How can we help?
Plain-English guides to PropertySurvey Pro. Search below, or pick a topic. Every answer starts with where to find the thing in the app.
Start here
Getting started
New to the app? Start with these.
You can be surveying within five minutes. The app works fully without an account.
- Install the app from the App Store or Google Play and open it. A short welcome tour runs once, then the app asks you to pick your region (that sets spelling, units and currency).
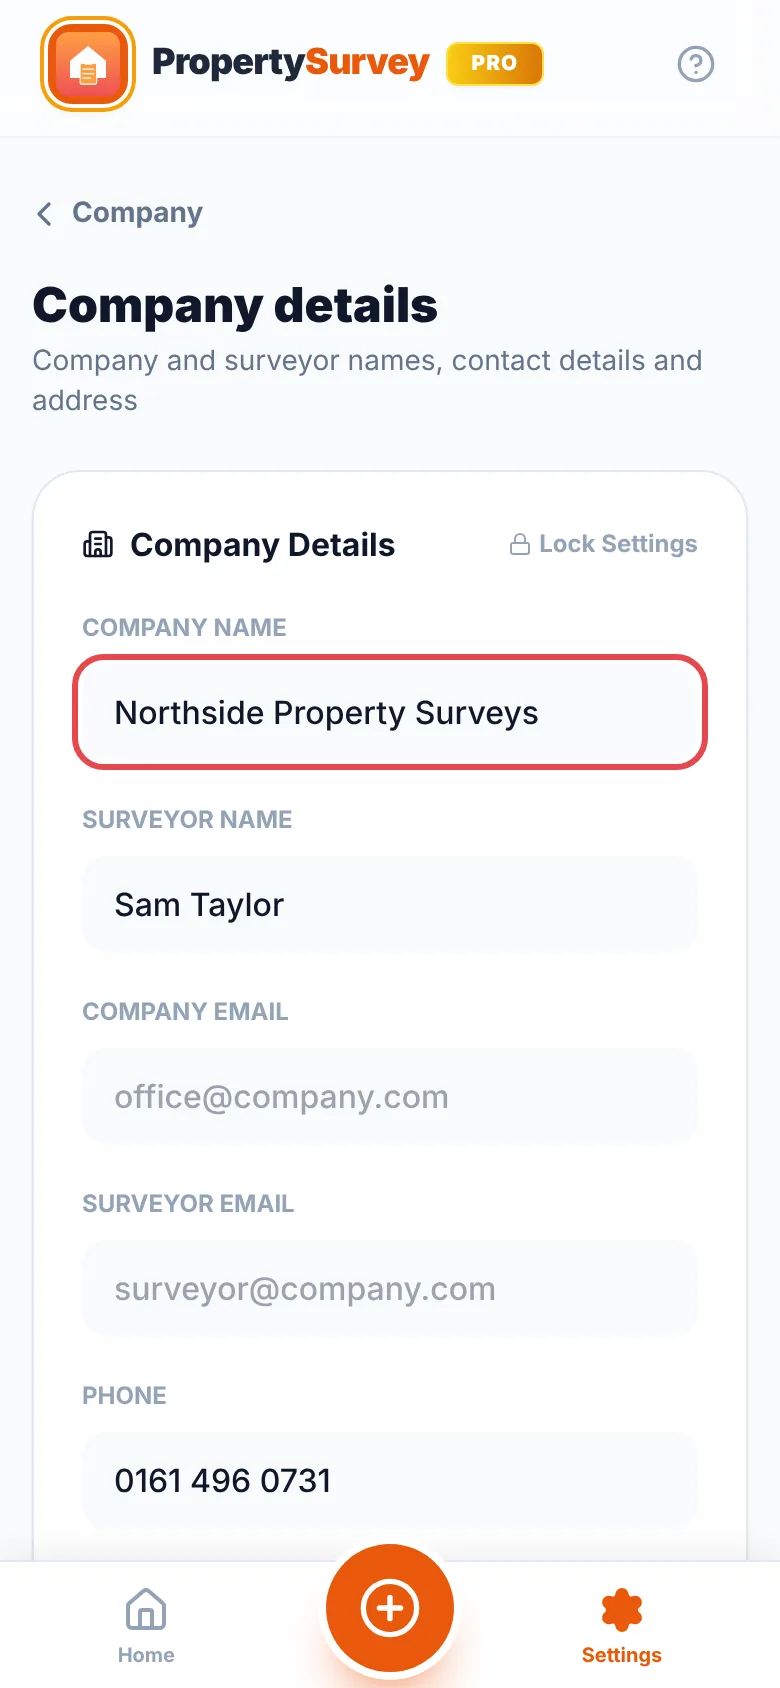
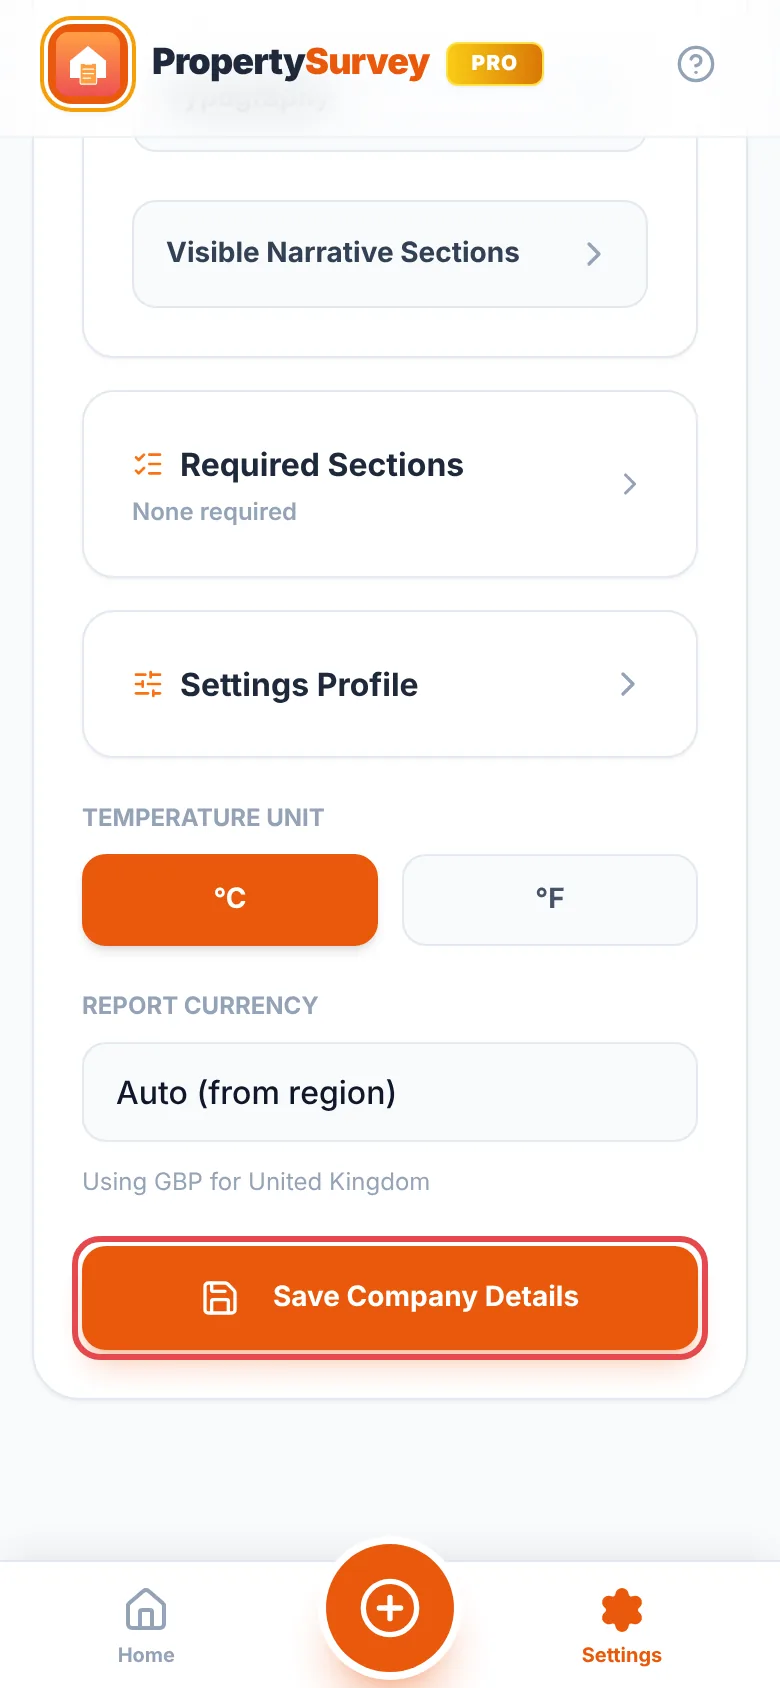
- Add your company details. Tap “Settings” (the gear, bottom right), then “Company” and “Company details”, fill in your details and tap “Save Company Details”. A company name is needed before you can start a survey, and these details print on every report.
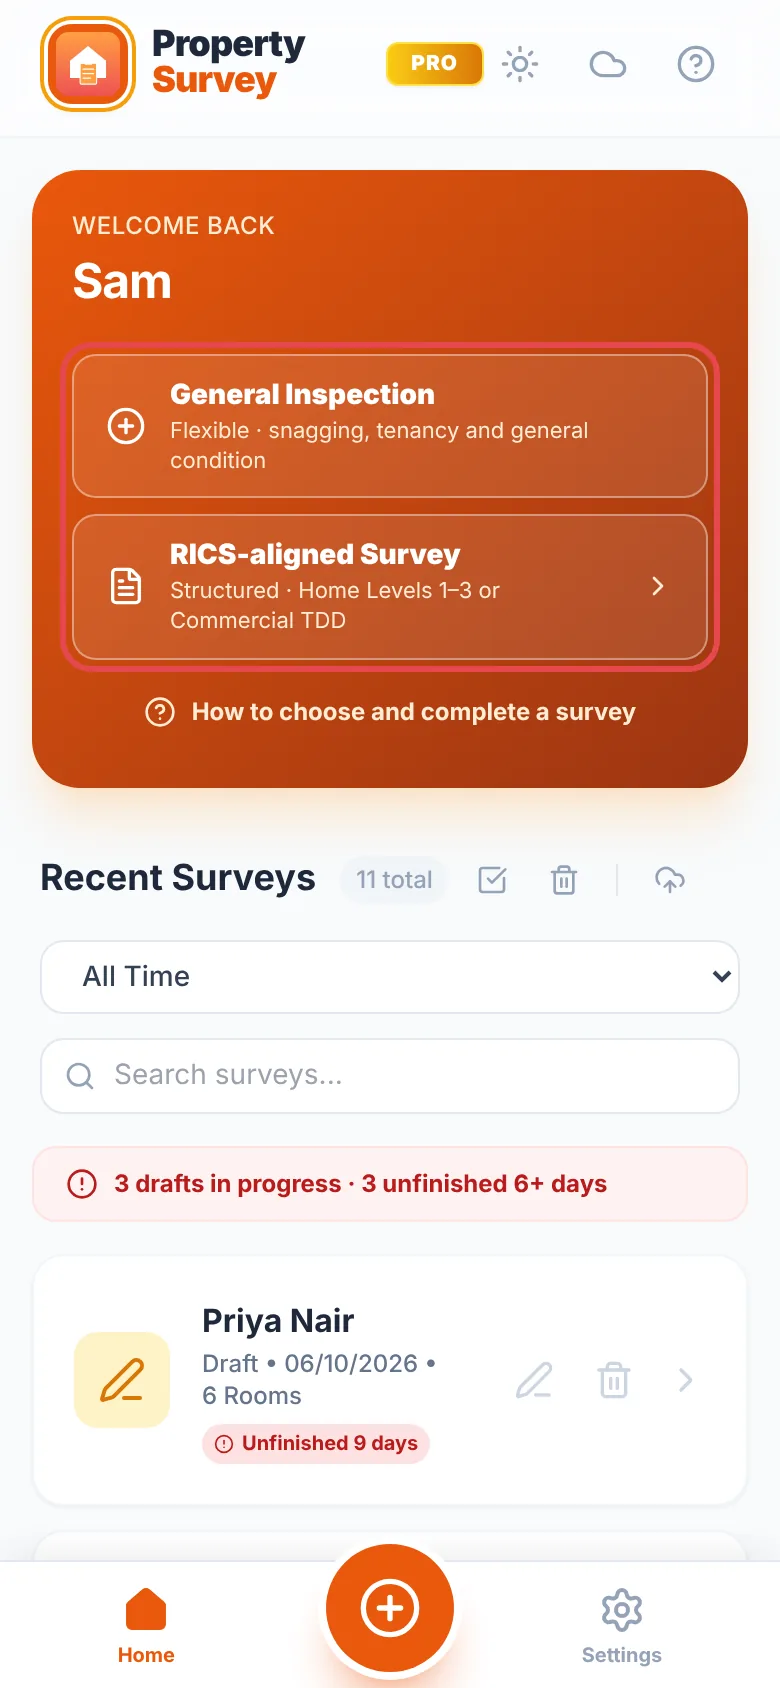
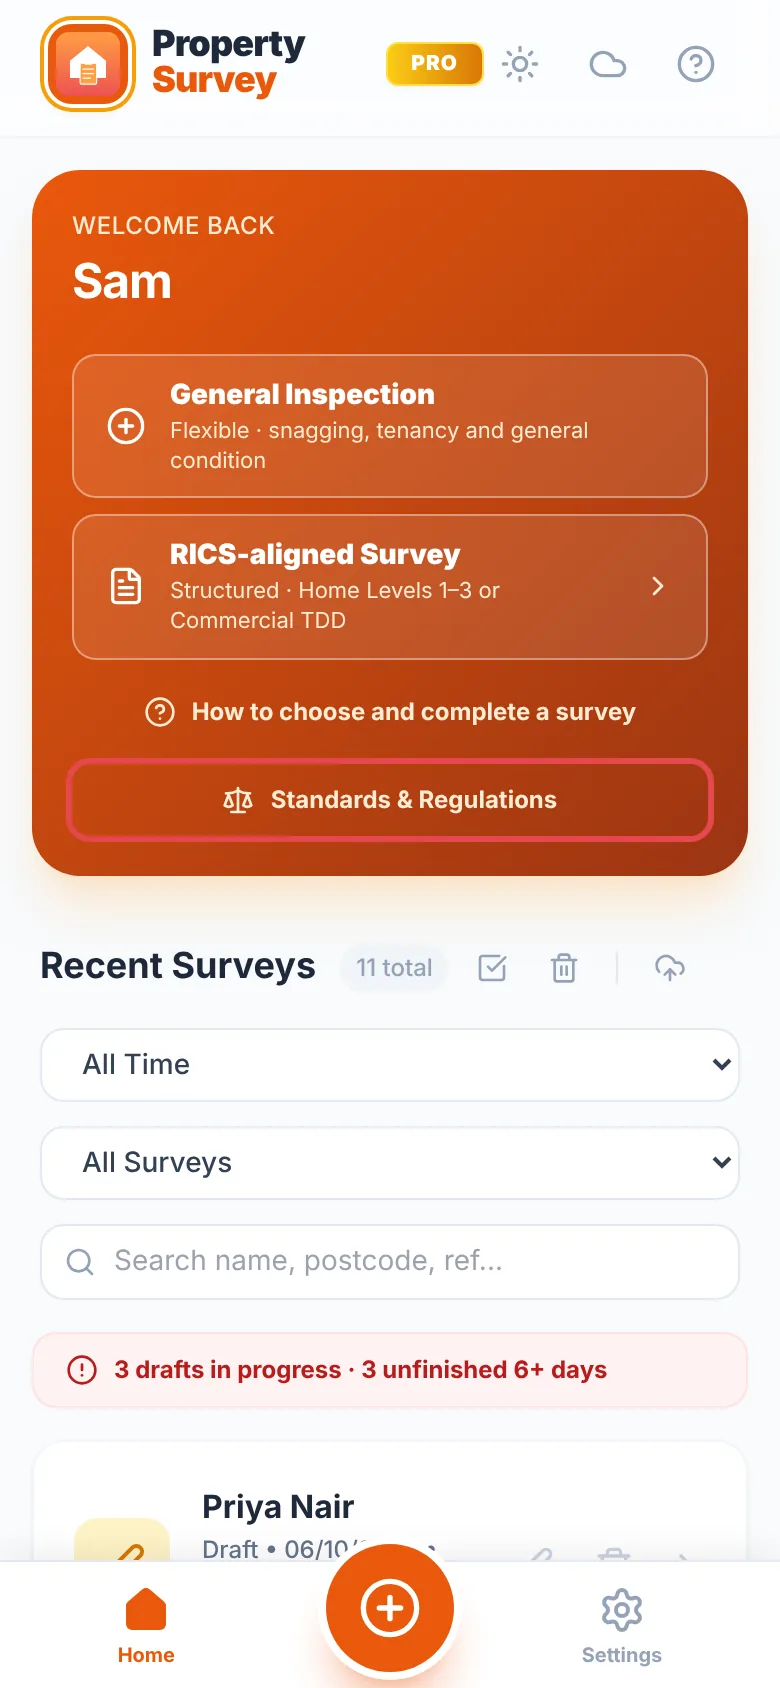
- Choose a survey type. On the home screen, tap “General Inspection” for snagging, tenancy or general condition work, or “RICS-aligned Survey” for a Home Survey (Levels 1 to 3) or a Commercial Survey. The round + button offers the same choices. Not sure? See Which survey type should I use?
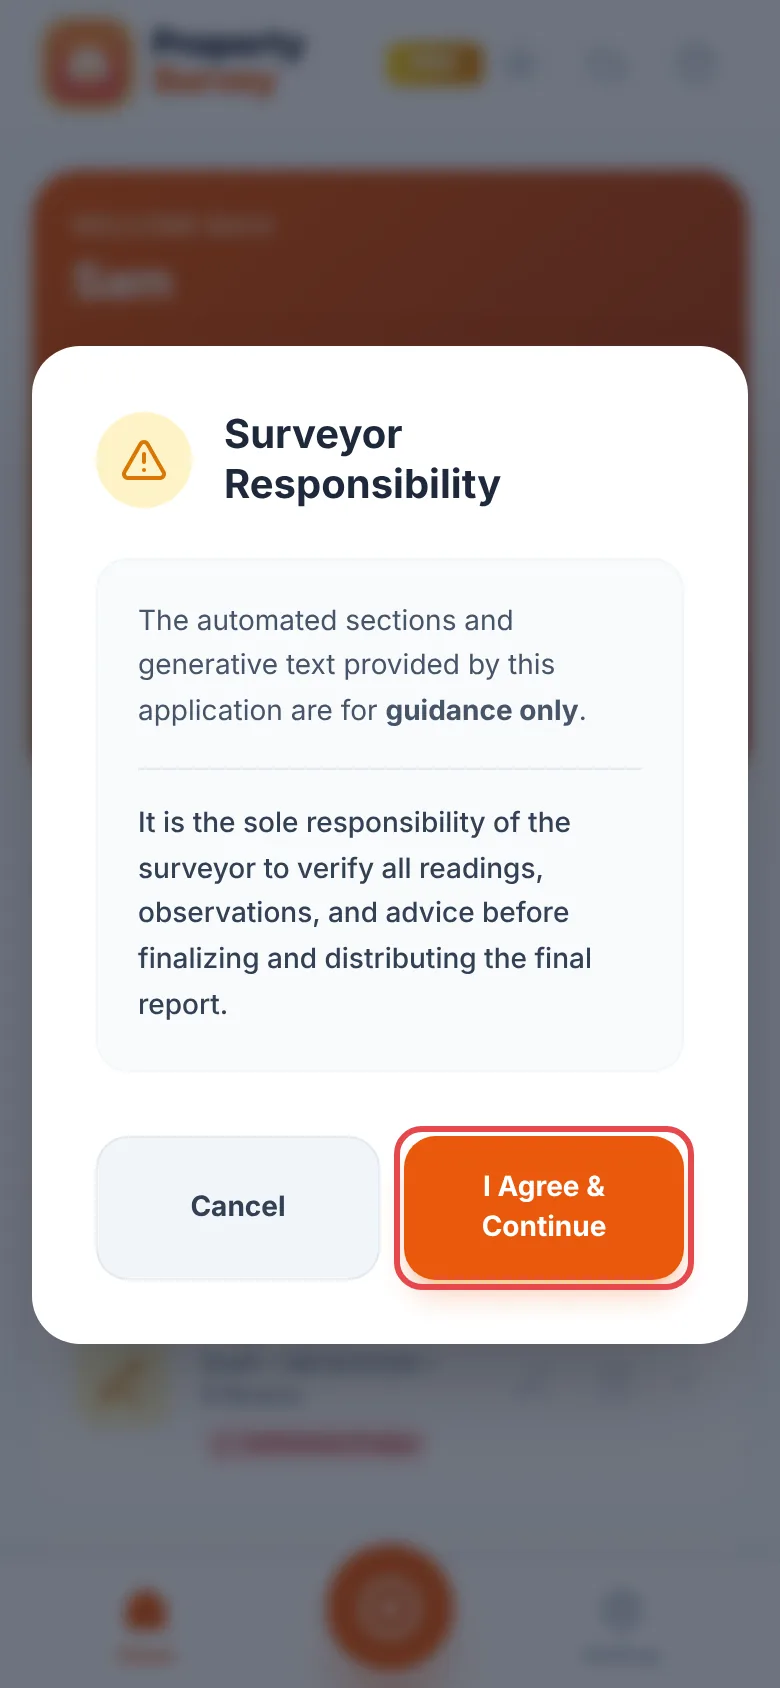
- Agree and start. Read the “Surveyor Responsibility” note and tap “I Agree & Continue”.
- Work through the sections. Fill in the property and client details first, then the rooms, elements, photos and ratings that apply to the property.
- Check and send the report. Open the report preview, read it through, tap “Save”, then “Share”. See Preview and finish the report.
For a fuller walk-through, read Getting started. On the app's home screen, “How to choose and complete a survey” opens a short guide inside the app.
PropertySurvey Pro is free to download and use. You can complete General Inspections, Home Surveys and Commercial Surveys, preview the report and share the PDF without paying. Pro is an optional subscription for people who survey often or want their own branding.
| Feature | Free | Pro |
|---|---|---|
| Surveys stored | Up to 25 surveys on this device | Up to 5,000, backed up to the cloud |
| General Inspection, Home Survey Levels 1 to 3, Commercial Survey | Included | Included |
| Rooms, photos, ratings, on-site tools, floor plan drawing, report preview, Share | Included | Included |
| Email reports from your own address (SMTP) | Included | Included |
| Smart Build ready-made wording | A few reports each month | Every report |
| Default wording every new General Inspection starts with | Not included | Included, with Smart Build |
| AI Polish, photo analysis, AI summary, talk through a room | 3 free uses of each every month | Daily use, or unlimited with your own key |
| Your logo, colours and fonts; no app footer on the PDF | Not included | Included |
| Cloud backup, sign-in and syncing between devices | Not included | Included |
| Live weather, soil data, planning check, UK EPC lookup, AR room scanning | Not included | Included |
| HHSRS scoring, standards reference, photo timestamps | Not included | Included |
| Photo captions | Included | Included |
| Client sign-off: the tenant, landlord or client signs on your device | Included | Included |
| Photo markup (circles, arrows, drawing, labels) | Not included | Included |
| Follow-up visits from a finished survey | Included | Included |
| Changes since last visit section in the report | Not included | Included |
| Scott schedules for housing disrepair, dilapidations and building disputes | Not included | Included |
On a free account you can still see every Pro setting: its switch or picker sits under frosted glass with a crown, and a tap on it opens the upgrade screen. Pro sections of a survey, such as HHSRS Scoring and Scott Schedule, carry a PRO badge on the survey dashboard.
Free reports carry a small Produced with PropertySurvey Pro™ footer. Prices are on the pricing page. To upgrade, see Upgrade to Pro.
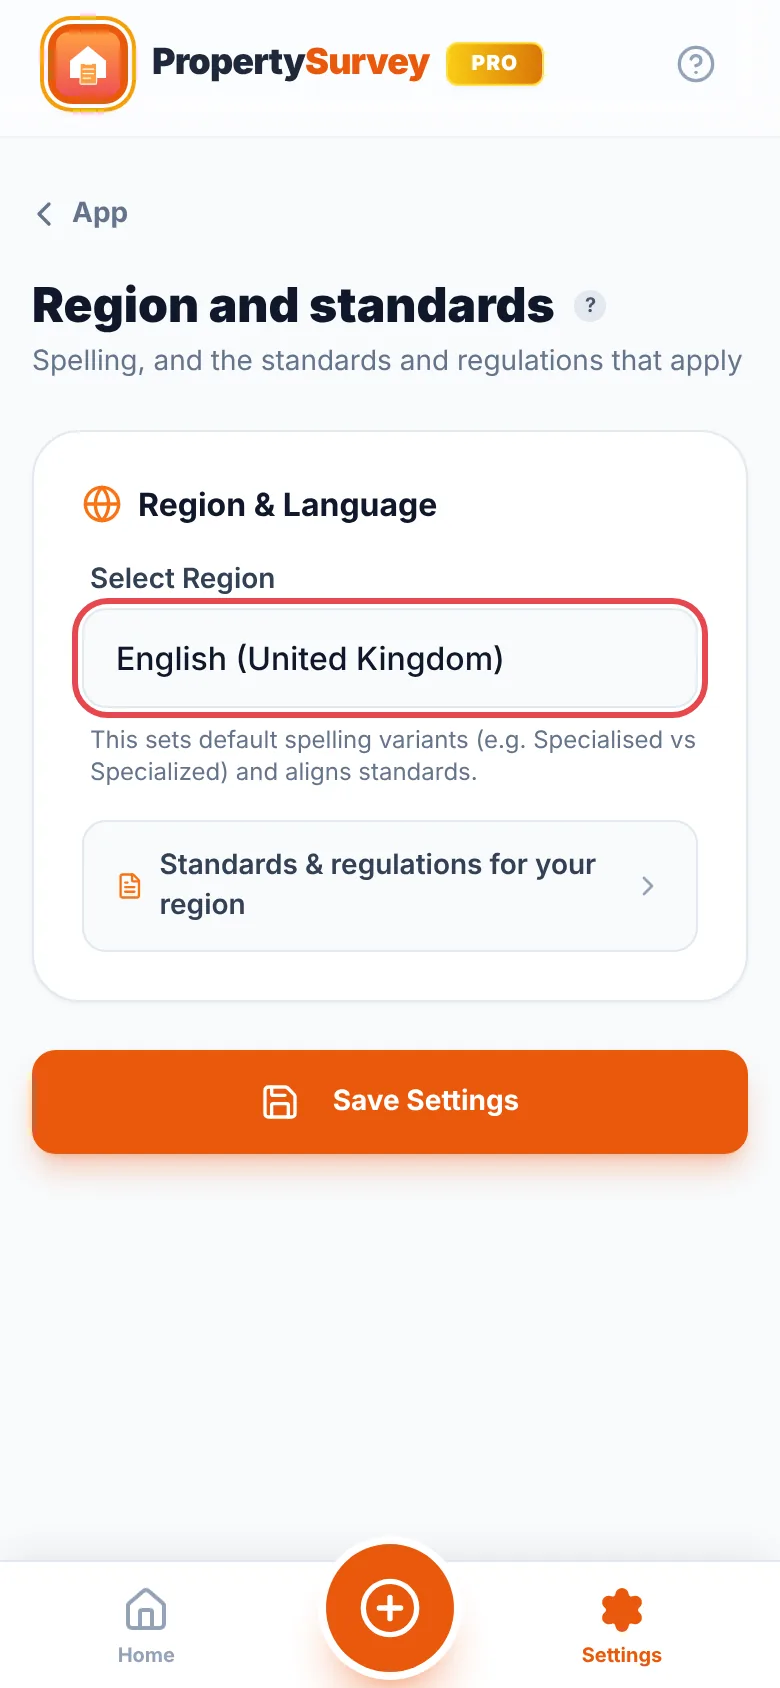
Where to find it:SettingsLanguage & Region
Pick your country under “Select Region”. The app then matches it everywhere:
- Spelling in the app, Smart Build, AI wording and the PDF: American in the US (mold, color), Canadian in Canada (mould, colour, analyze) and British everywhere else.
- Currency for costs.
- Temperature: °C, or °F for US regions.
- Tax label on your company details (VAT, ABN, GST and so on).
- AI wording, so AI Polish and the summary write in your regional English.
Where to find it:SettingsAppText Size
Free for everyone, in app version 1.7.0 and later.
- Open “Settings”, then “App” and “Text size”.
- Under “Text Size”, tap “Match my phone” to use the text size set on your phone, or tap a size from “Smaller” to “Largest”.
- The app changes straight away. Tap another size if it does not suit you.
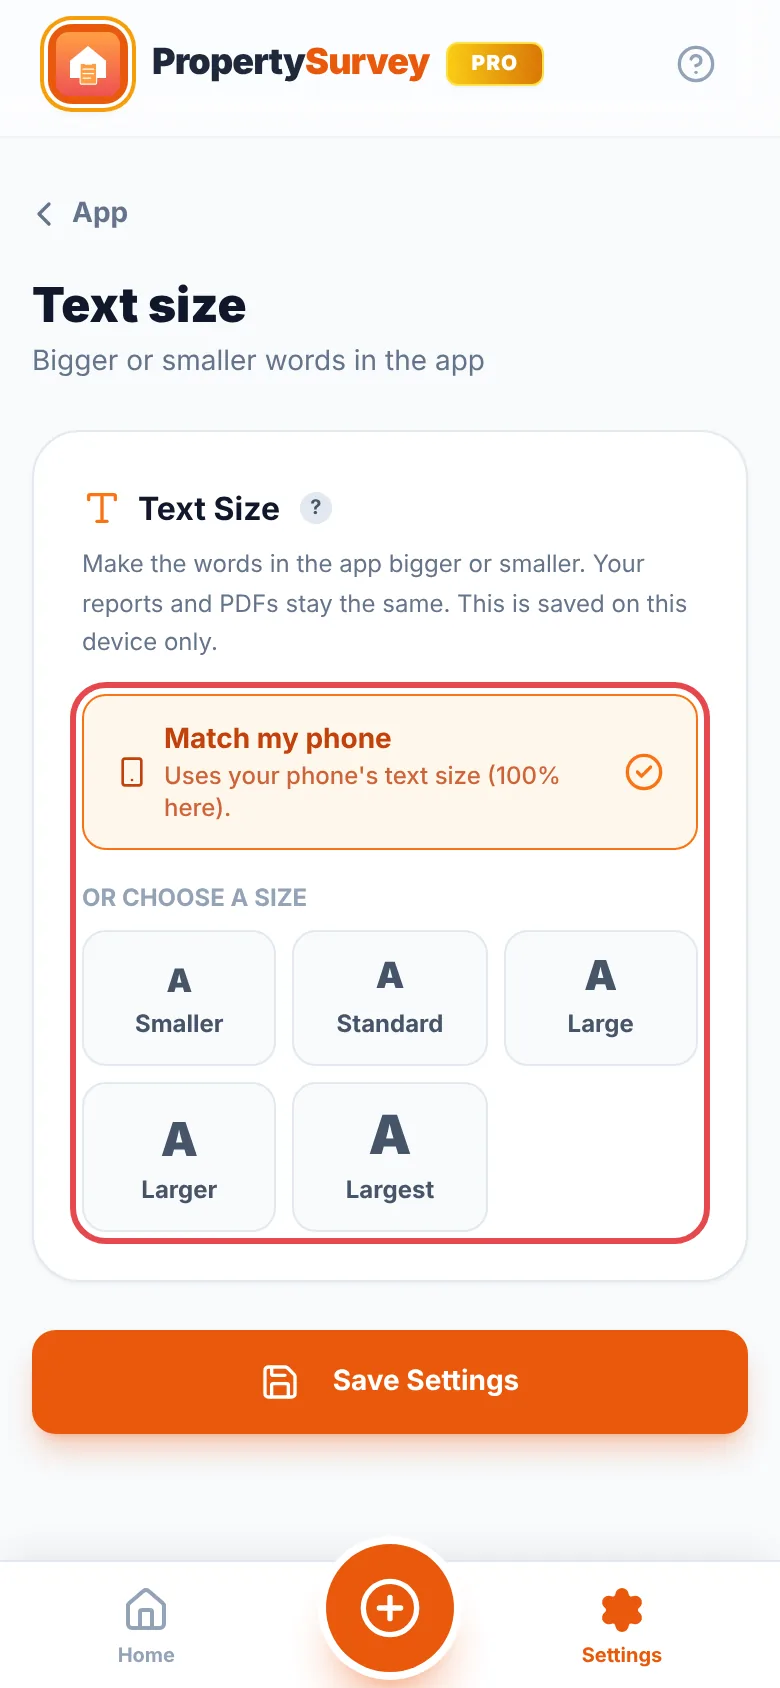
- Match my phone is where the app starts. On an iPhone or iPad, the phone's size is in Settings → Display & Brightness → Text Size. On Android it is usually Settings → Display → Font size.
- Very large phone sizes are shown at the app's “Largest”, so every screen still fits.
- Only the words in the app change. Your reports, the report preview and the PDF your client gets stay the same.
- The size is saved on each device, so your phone and tablet can be different.
Where to find it:SettingsAppFeature Tips
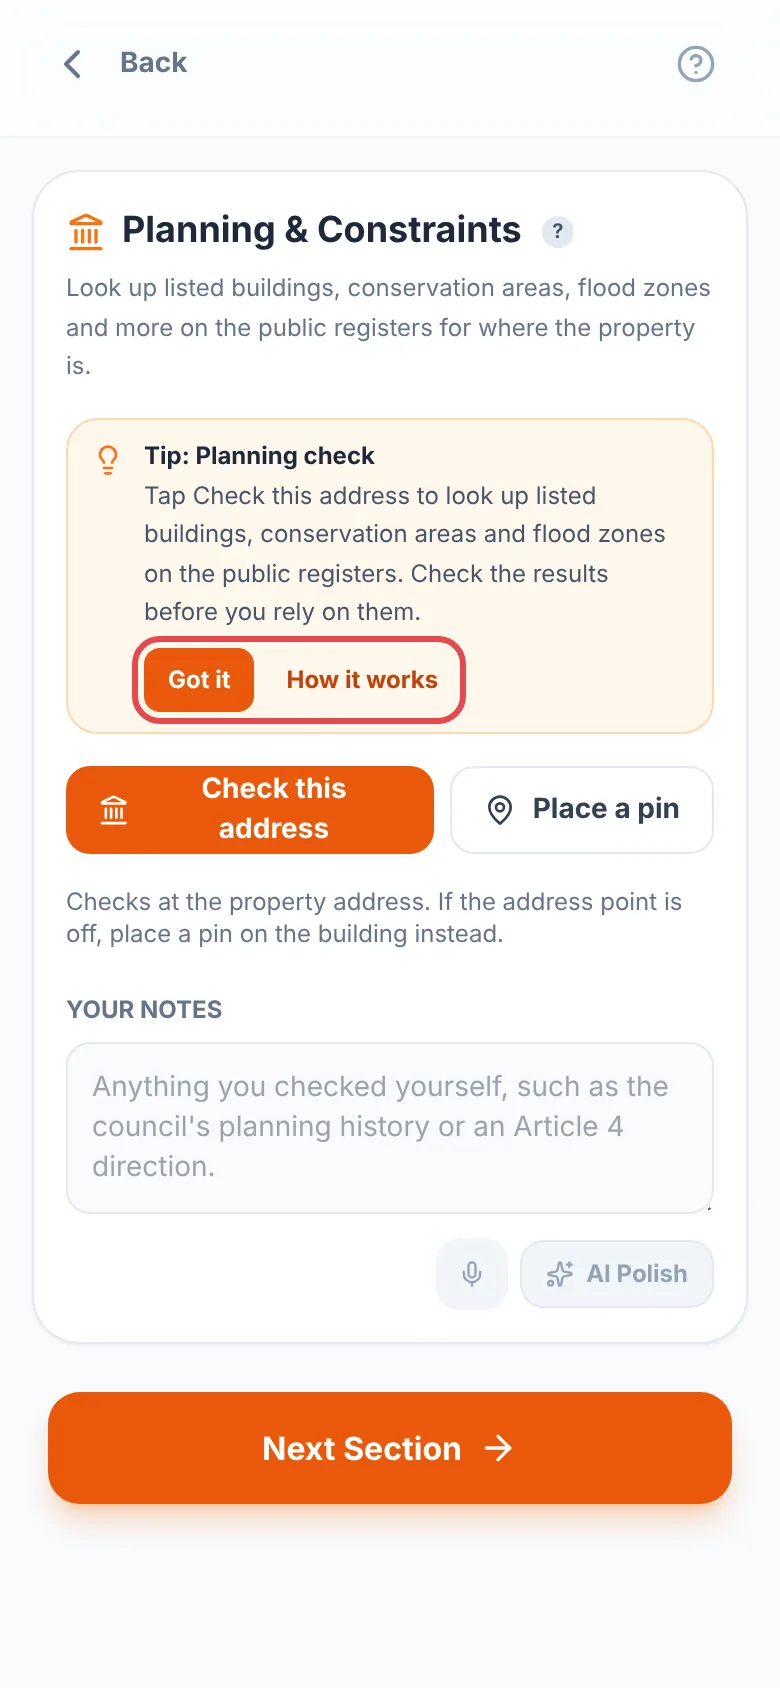
The first time you reach a new feature, a short tip explains it. Tap “How it works” to see the steps in the app, with a button to open this help page. Only one tip shows at a time.
- Tap “Got it” to hide a tip. It also goes once you use that feature.
- Tap the “?” beside a feature's name at any time to see how it works.
- Headings, sections and settings have a “?” too. Tap it to see what that part is for. It works whether tips are on or off, and never shows in your report.
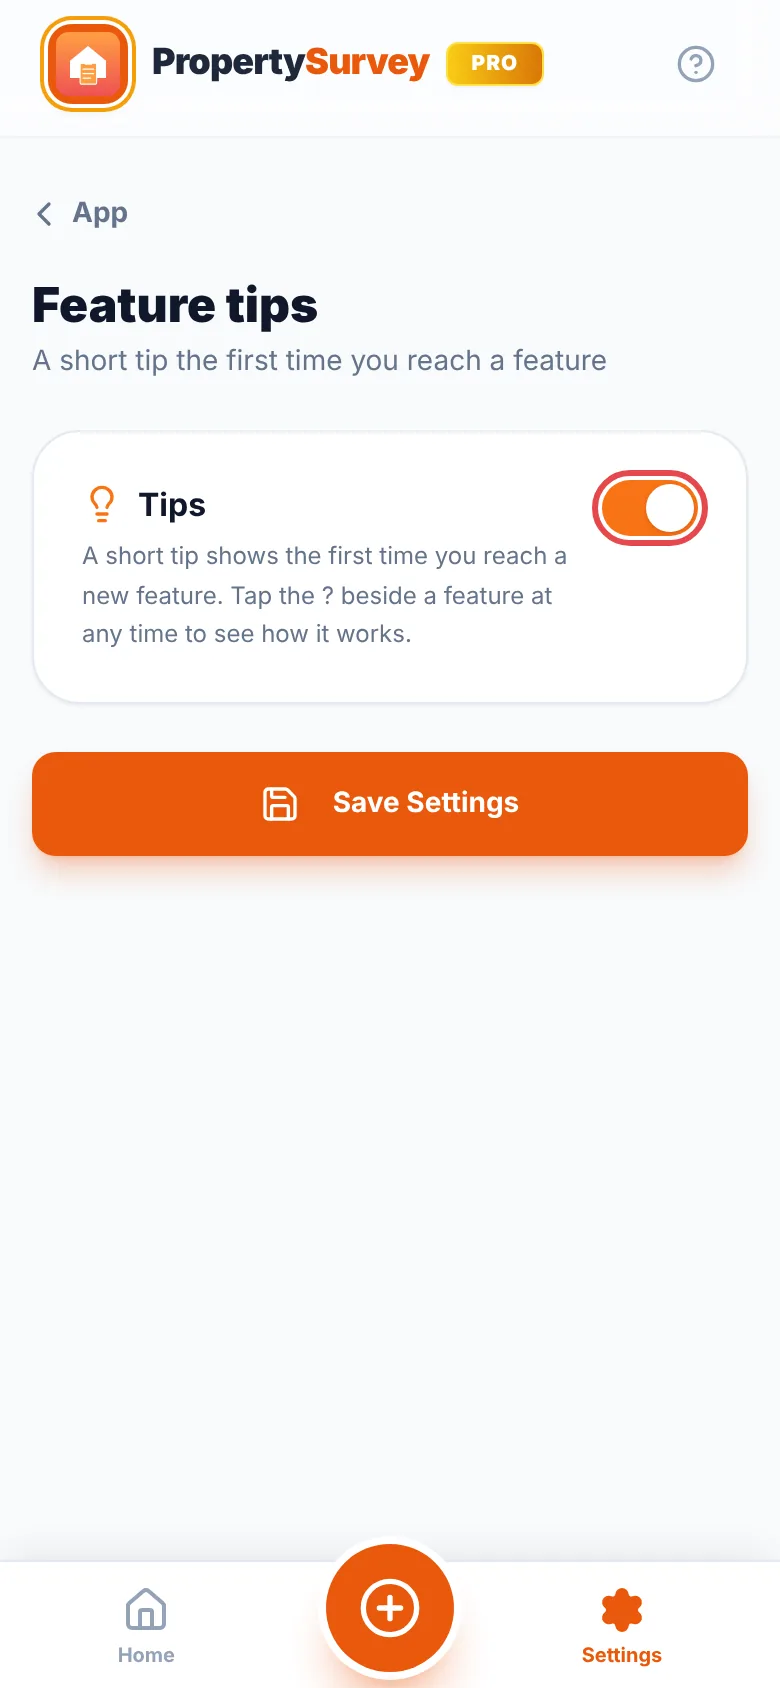
- To stop tips, turn off “Tips” in Settings → App → Feature tips. “Show all tips again” brings back every tip you have hidden.
- Tips are saved on each device.
You never need a signal to survey. Rooms, photos, ratings, floor plans, signatures and the finished PDF all work offline.
These need a connection: live weather, the UK EPC lookup, soil data, the AI tools and cloud sync. If you are offline, tap them again once you have signal. Only cloud sync retries by itself.
Cloud sync PRO: when you are signed in with Pro, each survey backs up automatically and appears on your other devices. Tap the cloud icon on the home screen, or “Sync Now” in SettingsAccount, to sync straight away.
Editing one survey on two devices
Sync keeps the most recently saved copy of each survey as a whole. If you edit the same survey on two devices while offline, the older edits are replaced. Finish a survey on one device at a time.
Tap the sun, moon or screen icon at the top of the home screen to switch between light and dark. The app starts by following your phone's setting; once you tap the icon it keeps the look you chose.
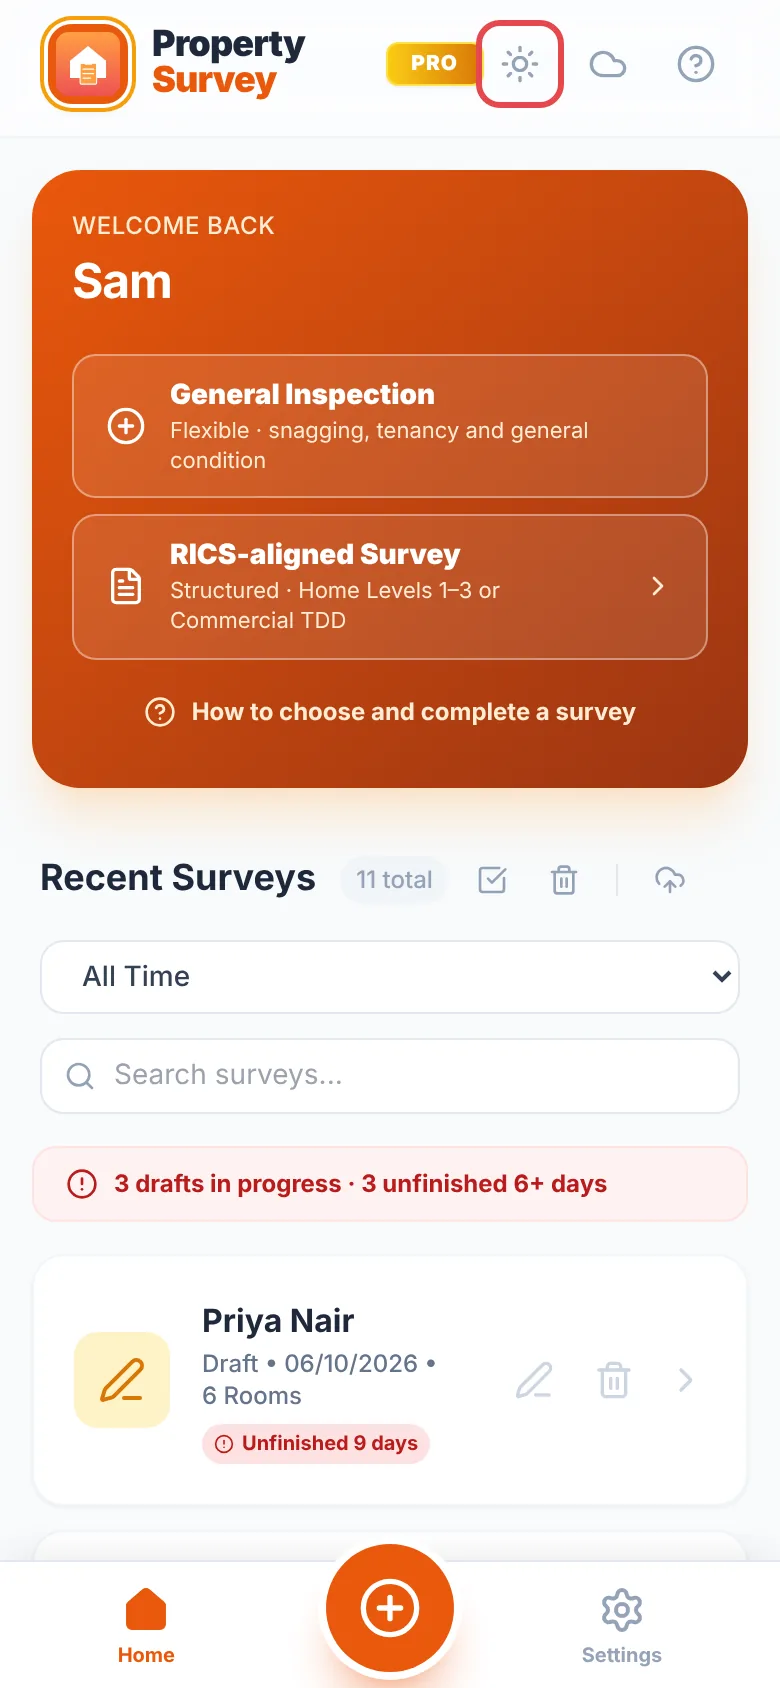
Reports and PDFs always show in light mode, so they print and read the same for your client.
Updates come through the App Store or Google Play, like any other app. Turning on automatic updates for your phone keeps you on the latest version.
- After an update, a “What's New” message may appear once. Tap “Got it, thanks!” to close it.
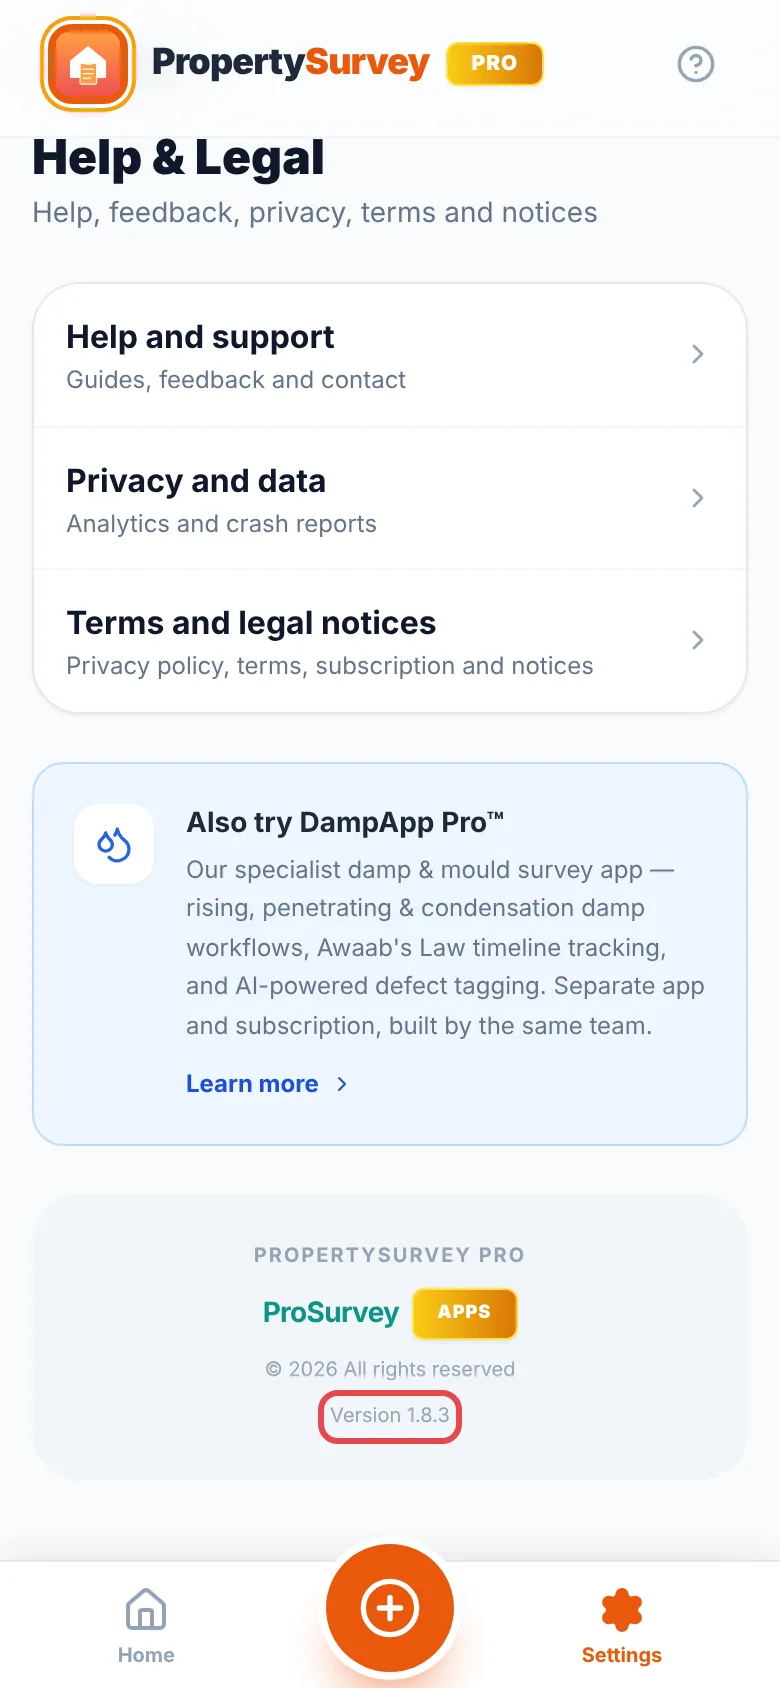
- Your version number is at the bottom of SettingsHelp & Legal. Please include it if you contact support.
- Updating never deletes your surveys.
Pro, subscriptions & billing
What Pro adds, how to upgrade, and how to restore or cancel it.
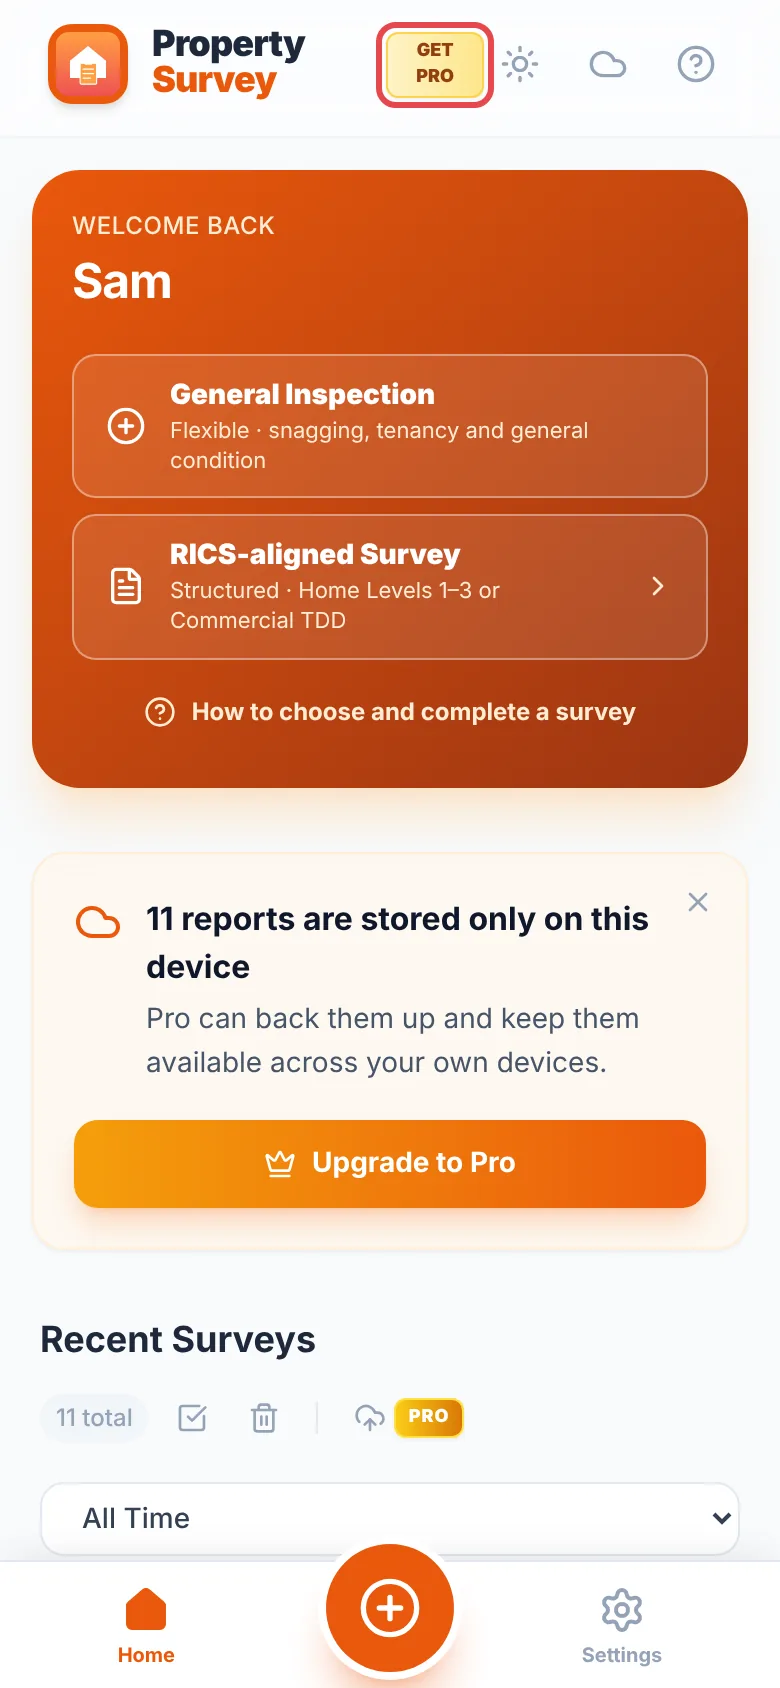
- On the home screen, tap the “GET PRO” badge at the top. Tapping any feature marked Pro also works.
- Choose monthly or yearly. If a free trial is offered, the button says so.
- Confirm with Face ID, your fingerprint or your store password. You pay Apple or Google, not us.
- You will see “Welcome to Pro!”. Pro features unlock straight away on this device.
Pro belongs to the Apple ID or Google account that bought it. To use it on another phone or tablet, see Restore Pro on a new or reset device. Then sign in to bring your surveys across (Sign in, sign out and reset your password).
If you have paid for Pro but the app shows the free version, restore your purchase. It is free and does not charge you again.
- Make sure the phone is signed in to the same Apple ID or Google account you used to buy Pro.
- Tap “GET PRO” on the home screen, then tap “Restore”.
- Or go to SettingsAccountManage subscription and choose “Subscription & billing”.
If you see “No previous purchase found to restore.”, the phone is probably signed in to a different store account, or the subscription has ended. Check in your store account (links in Manage or cancel your subscription).
Pro and your app login are separate
Pro follows your App Store or Google Play account. Your PropertySurvey Pro login is what brings your surveys across. On a new phone you usually do both: restore Pro, then sign in.
Where to find it:SettingsAccountManage subscription
This shows your plan and lets you change or cancel it. Apple or Google handle the billing, so cancelling happens in your store account:
- iPhone or iPad: Settings app → your name → Subscriptions. Apple's help (opens in a new tab).
- Android: Google Play → your profile picture → Payments & subscriptions → Subscriptions. Google's help (opens in a new tab).
Deleting the app does not cancel
Uninstalling PropertySurvey Pro does not stop the subscription. Cancel in your store account, as above. Refunds are handled by Apple or Google.
When Pro ends: your surveys stay on the phone. If you have more than 25, you can still open them, but you cannot start a new survey until you are within the free limit of 25. Cloud backups are deleted 30 days after Pro ends, so export anything you need first (Back up or move surveys with a JSON file).
Account, devices & data
Signing in, moving to a new phone, backups and deleting surveys.
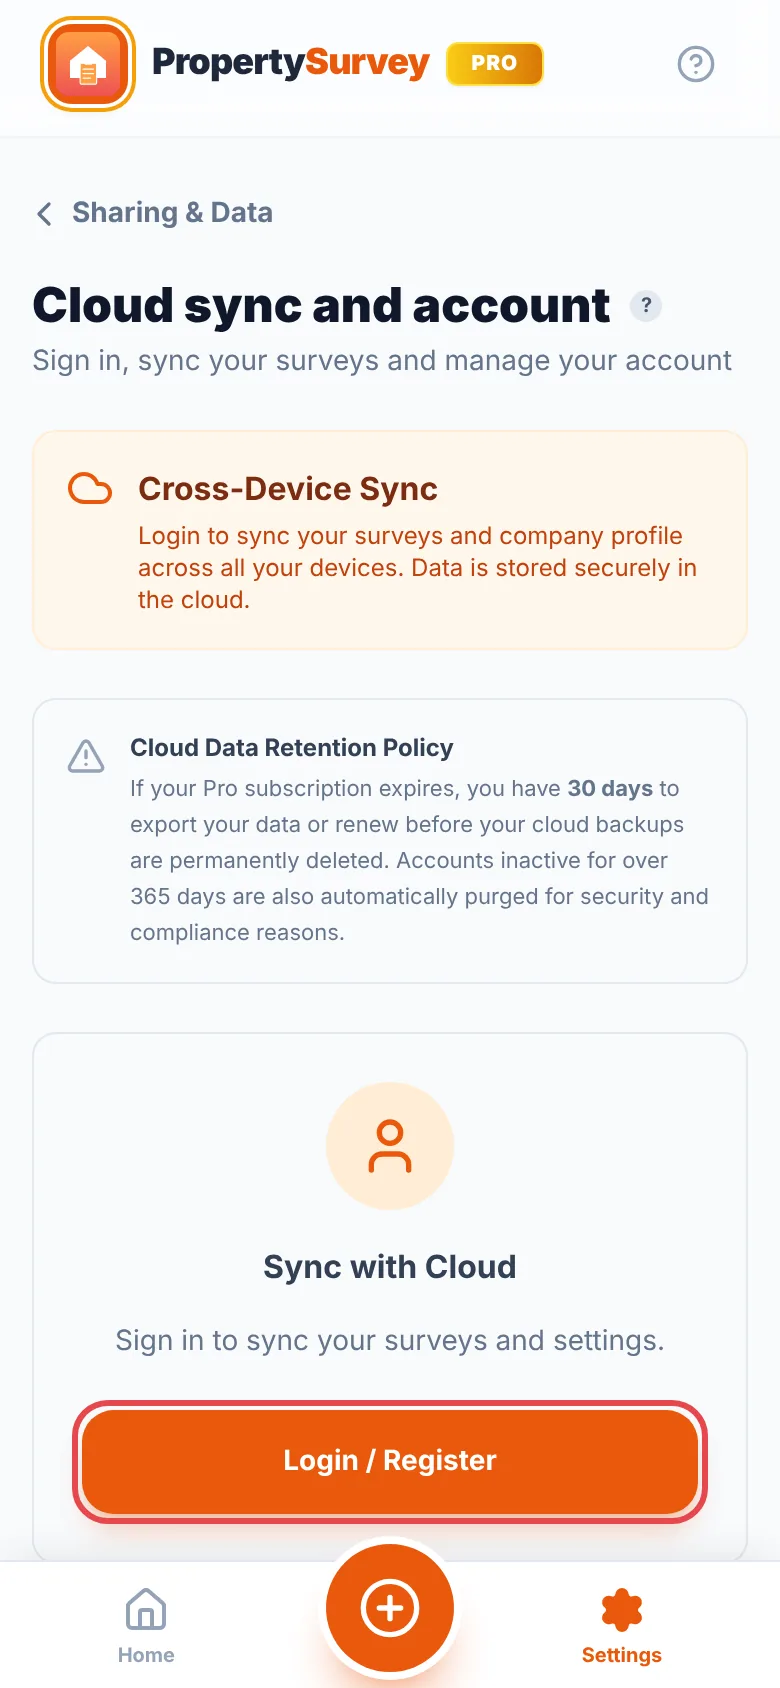
Where to find it:SettingsAccountLogin / Register
Signing in is part of Pro. It backs up your surveys and lets you open them on another device. Free users can use the app fully without an account.
- Tap “Login / Register”.
- Choose “Sign in with Google”, “Sign in with Apple”, “Sign in with Microsoft” (a personal, work or school account), or an email and password. For a new email account, tap “Sign Up”. The password needs at least 8 characters, including a capital letter and a number.
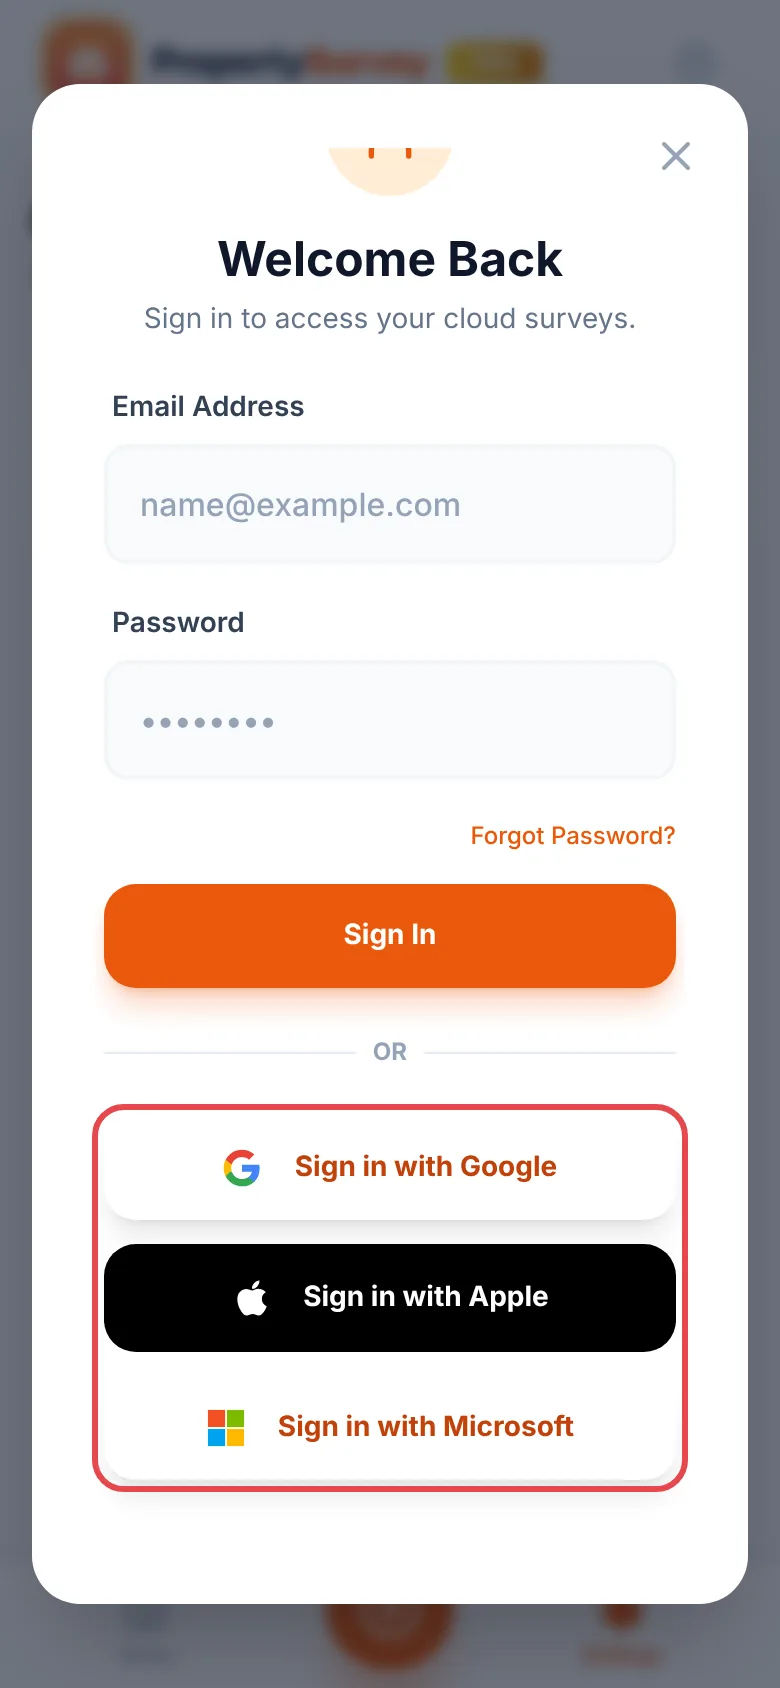
Forgotten password: on the sign-in screen tap “Forgot Password?”, enter your email and tap “Send Reset Link”. Check your inbox (and spam folder) for the link.
Sign out: SettingsAccountSign Out. Signing out does not cancel Pro.
With Pro:
- Install PropertySurvey Pro on the new device.
- Restore Pro: tap “GET PRO”, then “Restore”.
- Sign in with the same account as before: SettingsAccountLogin / Register. Your surveys and photos download.
On Free:
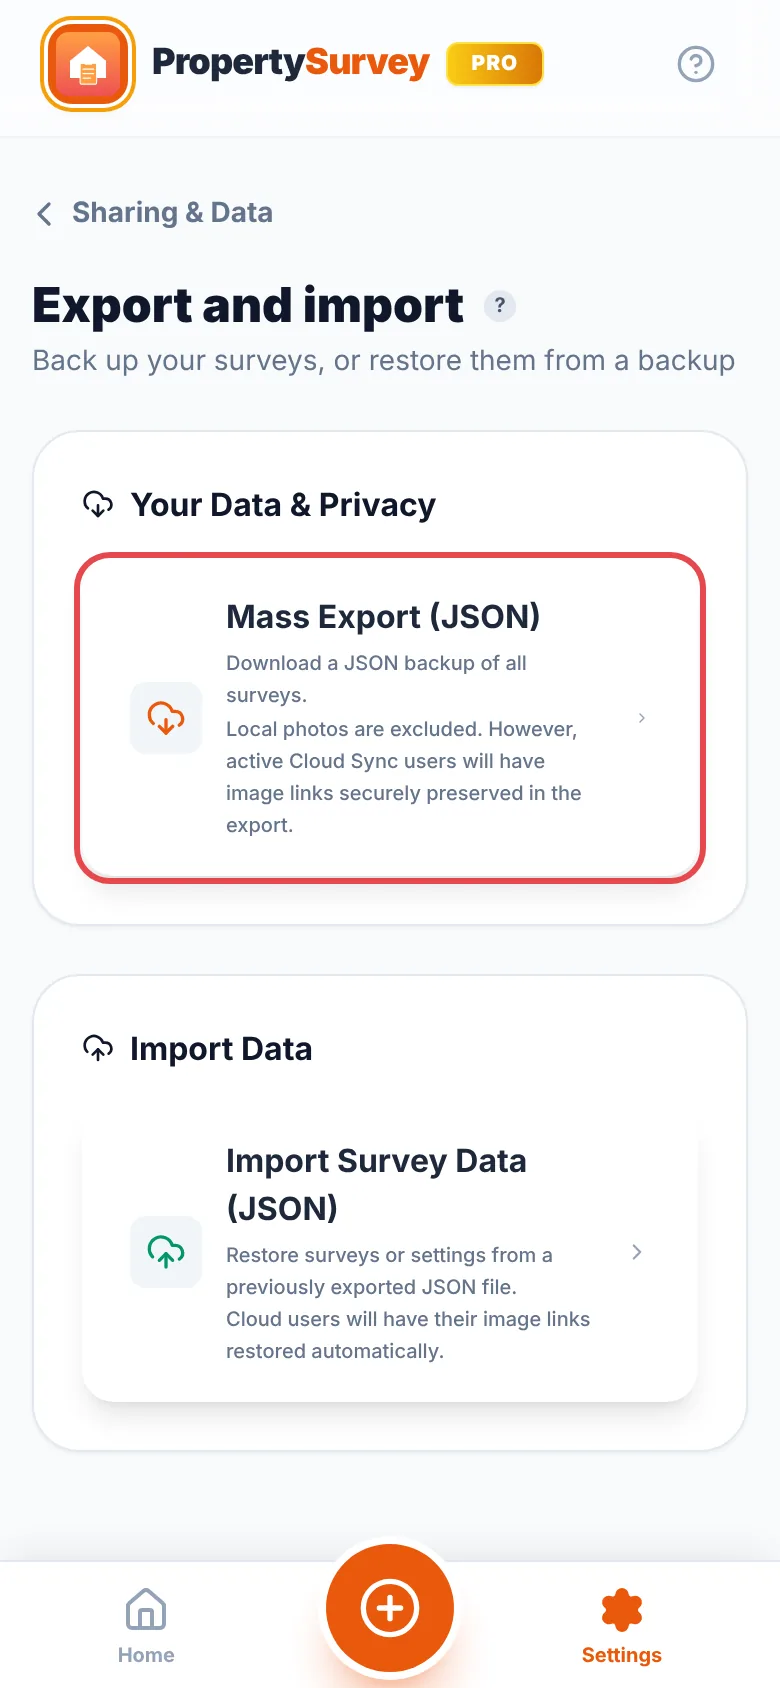
- On the old phone go to SettingsBackup & TransferExport and Import and tap “Mass Export (JSON)”. Save the file somewhere you can reach from the new phone, such as email or cloud storage.
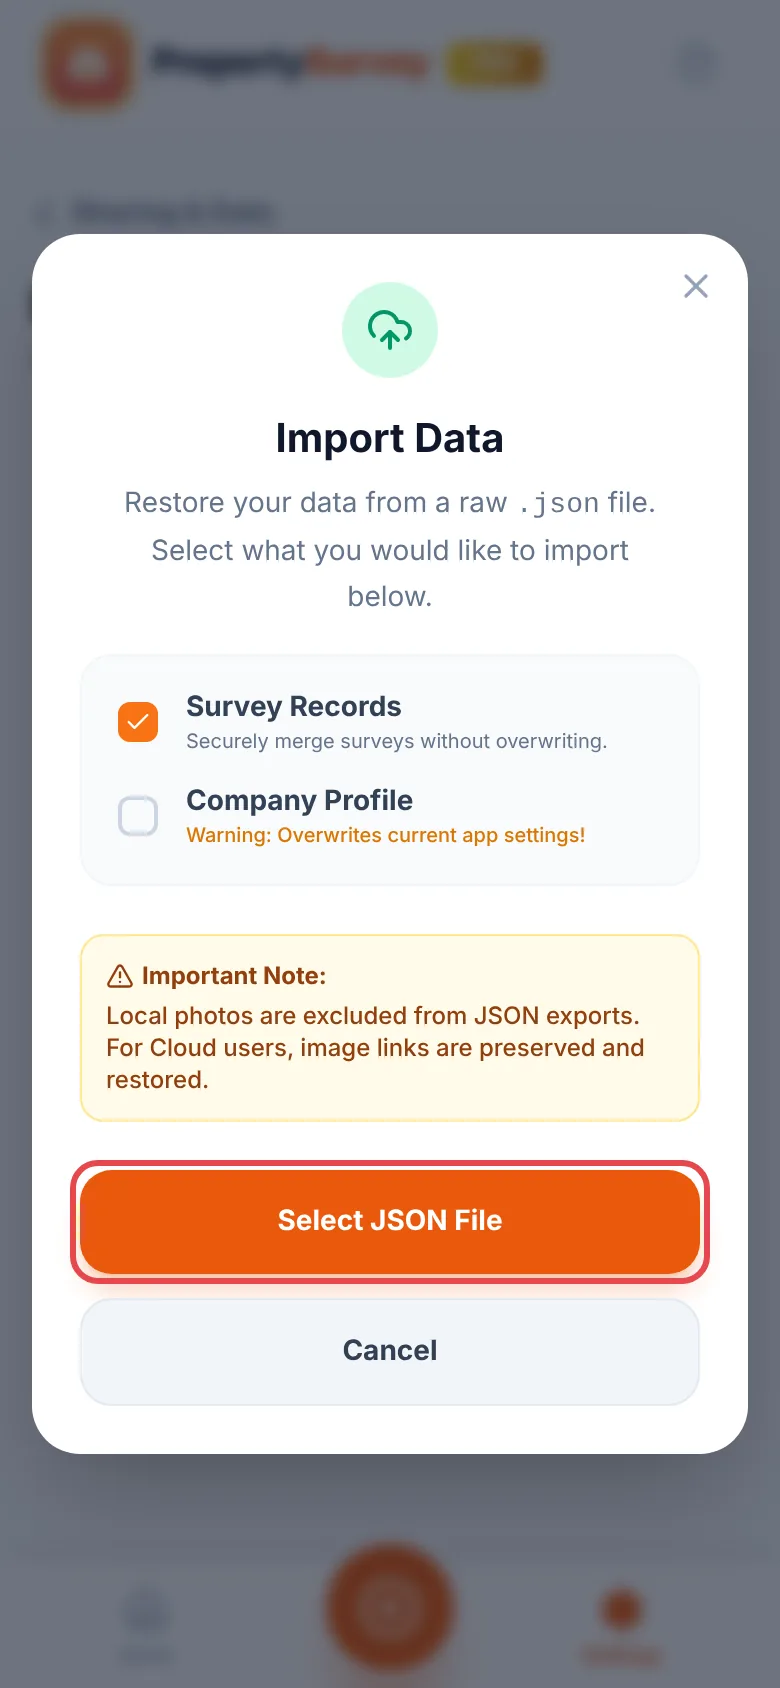
- On the new phone go to SettingsBackup & TransferExport and Import, tap “Import Survey Data (JSON)”, tick “Survey Records” and “Company Profile”, and choose the file.
Photos do not travel in a Free export
A JSON file carries the survey text and ratings, not the photos. Share the finished PDFs from the old phone first if you need the photos.
Free monthly allowances (AI and Smart Build) are counted on each device.
- On your phone: every survey is saved on the device first. On Free that is the only copy, so deleting the app deletes those surveys. Export a backup now and then (JSON backup).
- In the cloud PRO: when you are signed in with Pro, surveys and photos are also backed up securely and can be restored on another device.
- Limits: Free stores up to 25 surveys on the device; Pro up to 5,000. To make room, export or delete finished surveys.
- If Pro ends: cloud backups are deleted after 30 days. Accounts not used for 365 days are also removed.
The full policy is in SettingsAccount under “Cloud Data Retention Policy”, and in SettingsHelp & LegalTerms and Legal NoticesStorage Limits & Quotas.
You are responsible for your clients' personal data in your surveys (you are the data controller). Delete surveys you no longer need to keep.
A JSON file is a backup copy of your survey data that you can keep on a computer or load into the app again.
- Back up everything: SettingsBackup & TransferExport and ImportMass Export (JSON).
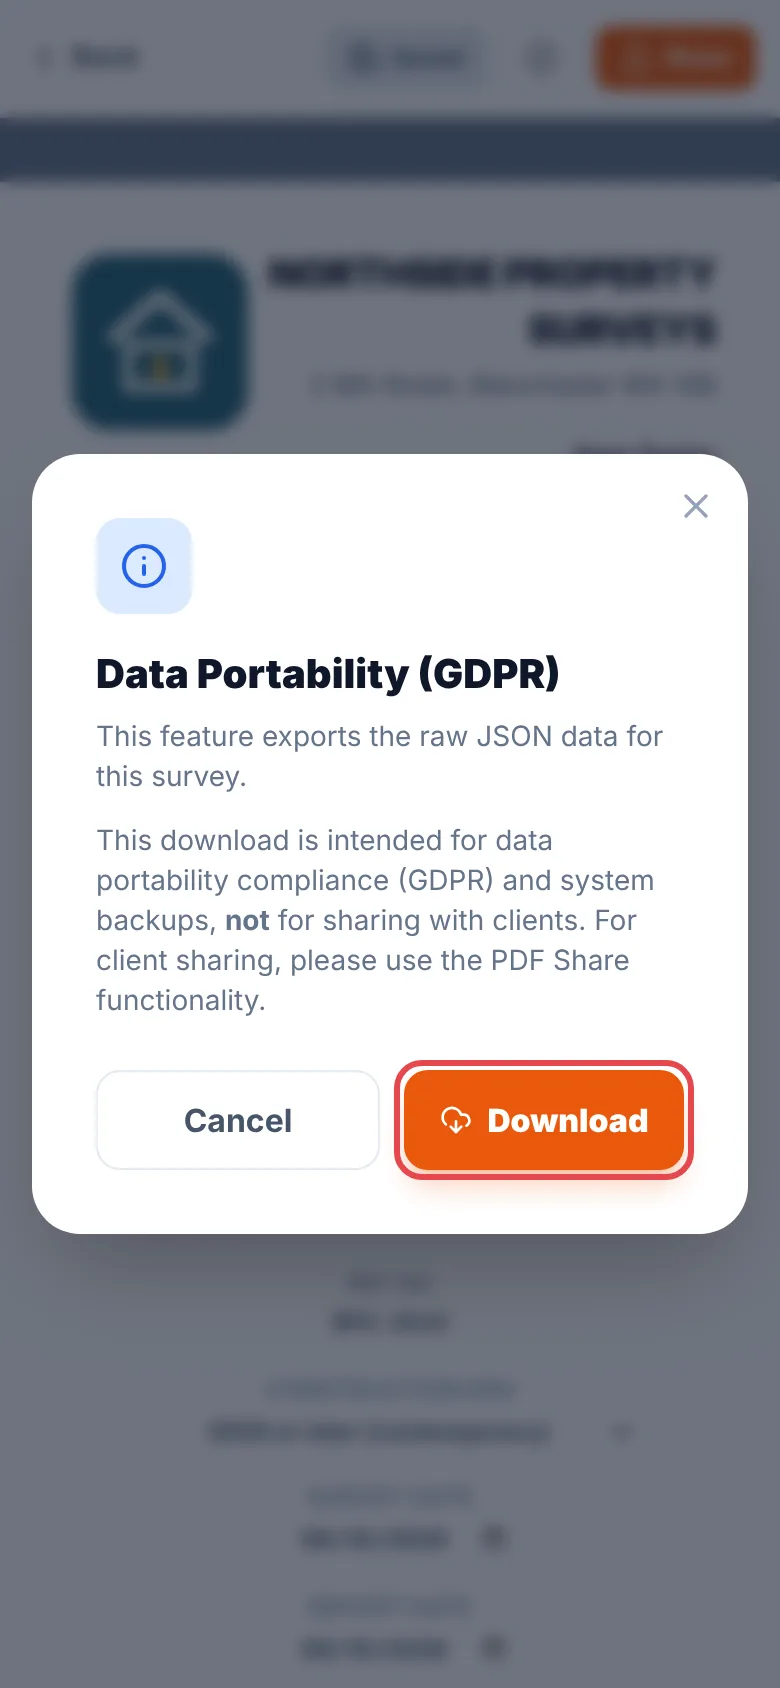
- Back up one survey: open its report, tap “More”, then “GDPR data export”, then “Download”.
- Load a backup: SettingsBackup & TransferExport and ImportImport Survey Data (JSON). Tick “Survey Records”, “Company Profile” or both, then tap “Select JSON File”. Importing a Company Profile replaces your current company details.
- Pro also has an import button on the home screen.
Photos: without Pro cloud sync, photos are not included. With Pro, the file holds secure links to your cloud photos, so they come back when you import.
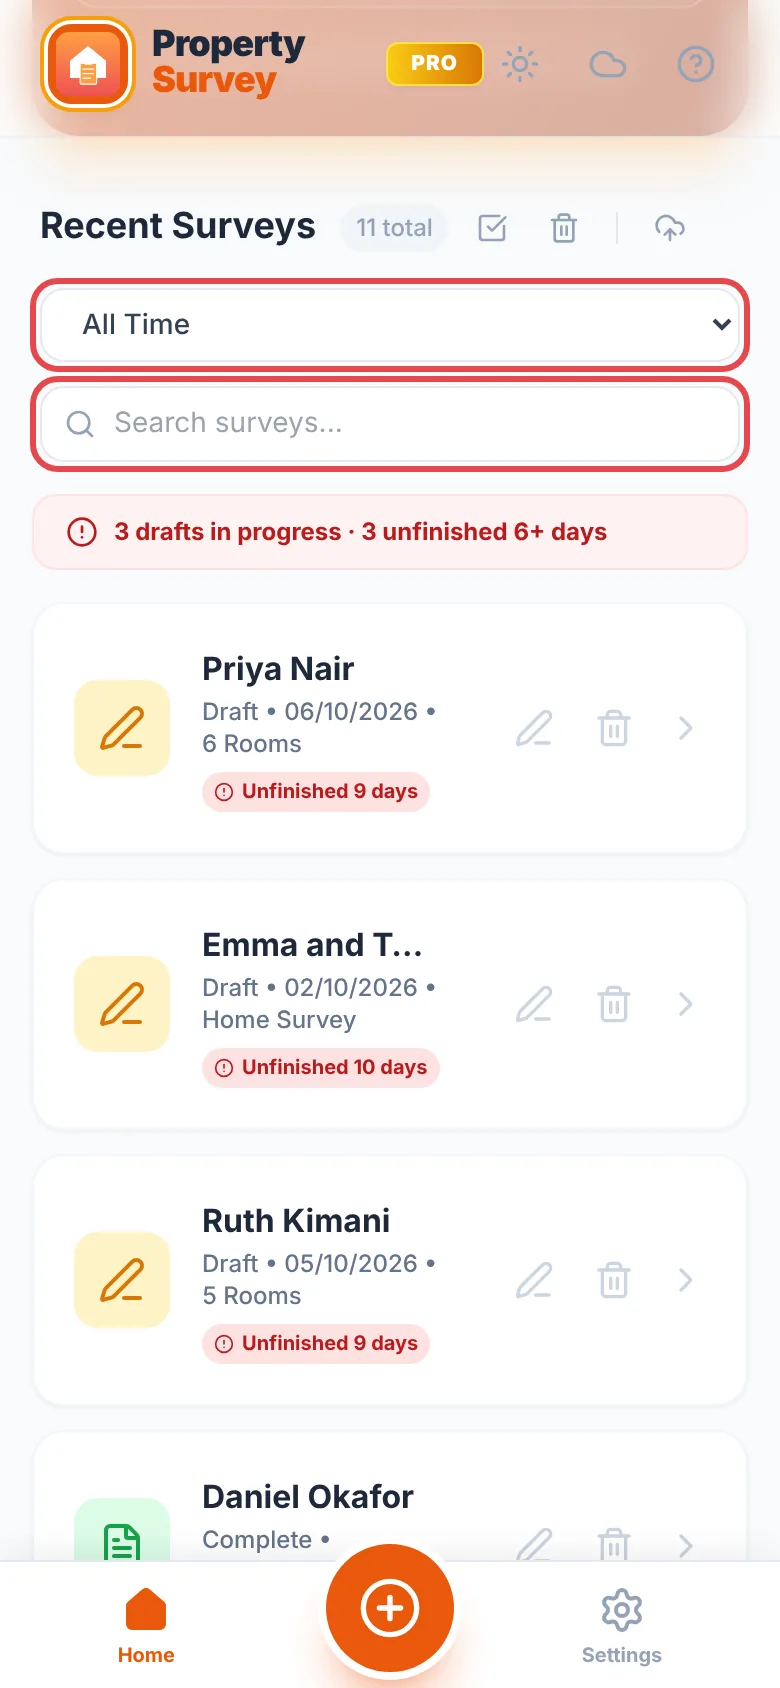
Where to find it:HomeRecent Surveys
- Search: type in the search box to find a client name, address, postcode, reference or status. Every word you type has to match, in any order, so "smith ls6" finds Mrs Smith's survey in LS6, and a postcode works with or without its space. The cross clears the box.
- Filter by date: use the dropdown beside the search box (All Time, Past 7 Days, Past 30 Days and so on).
- Drafts or complete: the next dropdown shows only drafts or only completed surveys. Tapping the drafts banner shows your drafts too.
- Delete one: tap the bin icon on the survey's row and confirm.
- Delete several: tap the tick-box icon by the survey count, choose the surveys, then delete.
- Delete by age: tap the grey bin icon by the survey count. Check the option before tapping “Delete Now”: it starts on “Every Single Survey In System”. Choose, for example, “Older than 90 Days” instead.
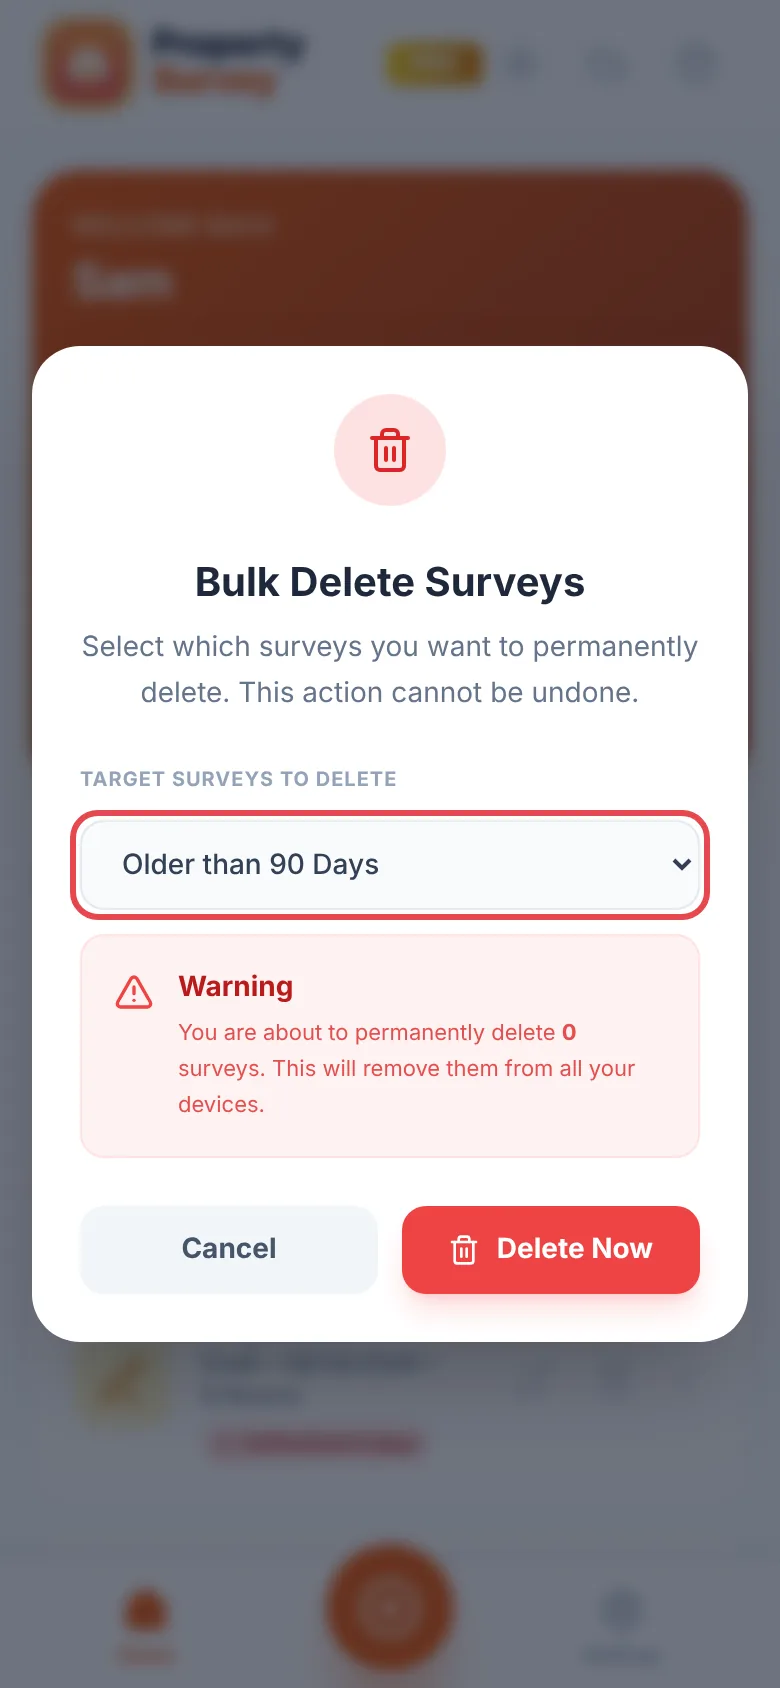
Deleting is permanent
With Pro cloud sync on, deleting on your phone also deletes the cloud copy. Export anything important first.
So that no survey is forgotten, the home screen flags drafts that have been left unfinished:
- A badge such as “Unfinished 4 days” appears on the survey. It turns amber after 3 days and red after 6.
- A line above the list counts your drafts in progress and how many have been waiting a long time.
- The app sends a reminder on your phone 48 hours after you last saved an unfinished survey. Nothing is sent over the internet.
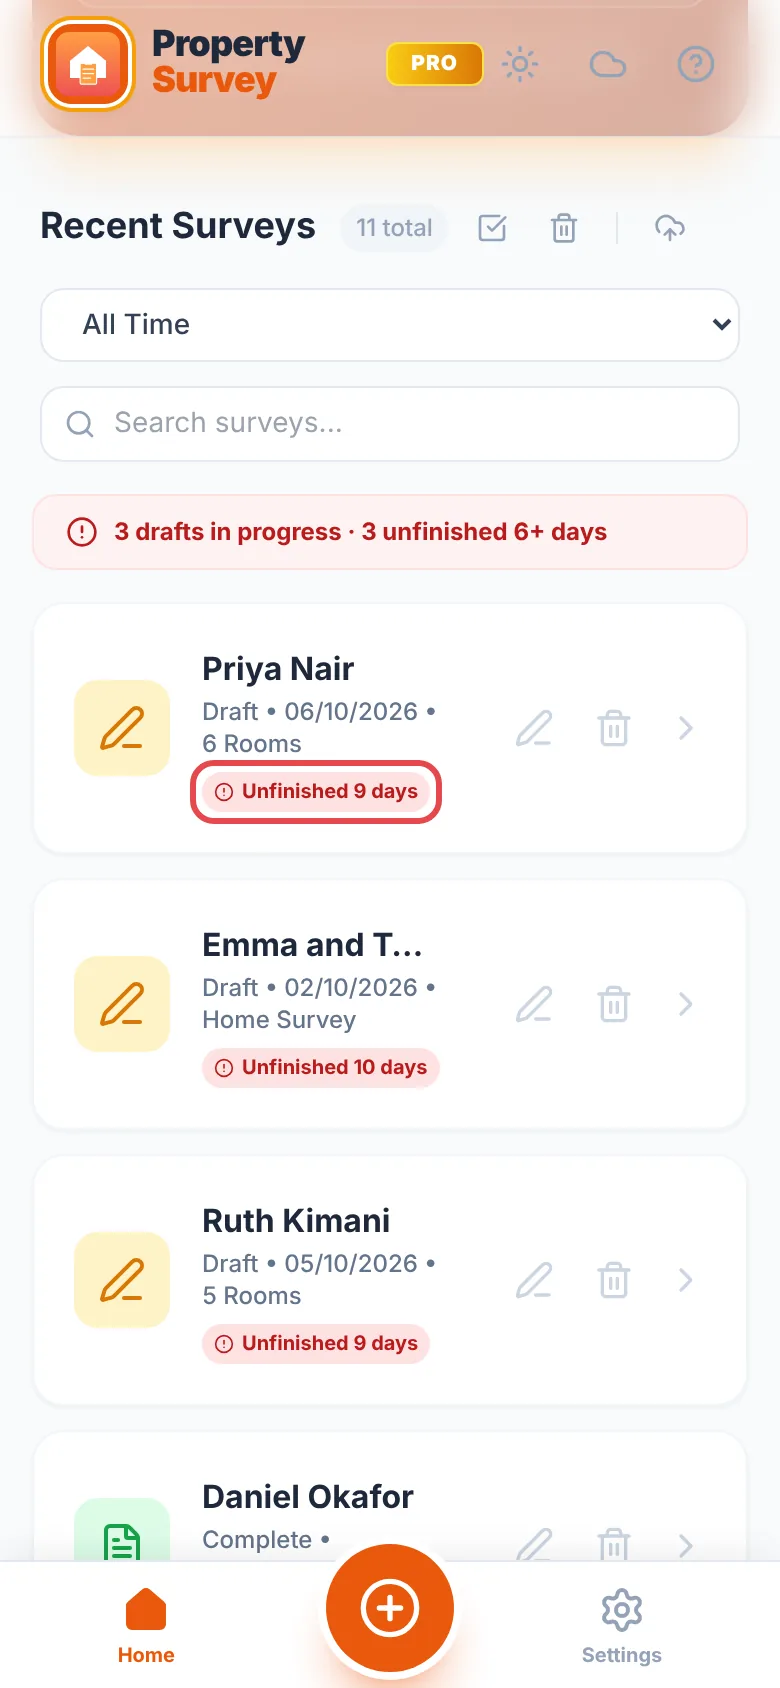
Finish the report, or delete the survey, and the badge and reminder go away.
Where to find it:SettingsAccountDanger ZoneDelete Account
This option shows only while you are signed in. Tap “Delete Account”, then “Yes, Delete Permanently”. It erases your login, everything backed up in the cloud, and the surveys stored on that phone. It cannot be undone, so export anything you want to keep first.
You can also delete your account from a computer on the delete account page.
This does not cancel Pro
Cancel your subscription in your App Store or Google Play account as well (how to cancel).
On a computer, go to the export page and sign in with your PropertySurvey Pro account. You can download all your synced surveys, or one at a time, as a ZIP file containing the survey data and full-size photos. Keep the window open while it builds; large accounts take a minute or two.
This is for backups and record keeping. The formatted PDF reports are made in the app.
Home and Commercial surveys
The structured workspaces for Home Survey Levels 1 to 3 and commercial work.
Tap “RICS-aligned Survey” or “General Inspection” on the home screen, or the round + button, which asks “What would you like to create?”.
| Choose | When |
|---|---|
| “General Inspection” | Snagging, tenancy, inventory-style and general condition reports. Flexible sections, room-by-room, with plain-language condition ratings. |
| “Home Survey — Levels 1–3” | Residential surveys following the familiar Level 1, 2 or 3 structure with CR1, CR2 and CR3 ratings. You set the level inside the survey. |
| “Commercial Survey” | Building condition surveys, technical due diligence and schedules of condition for commercial property. |
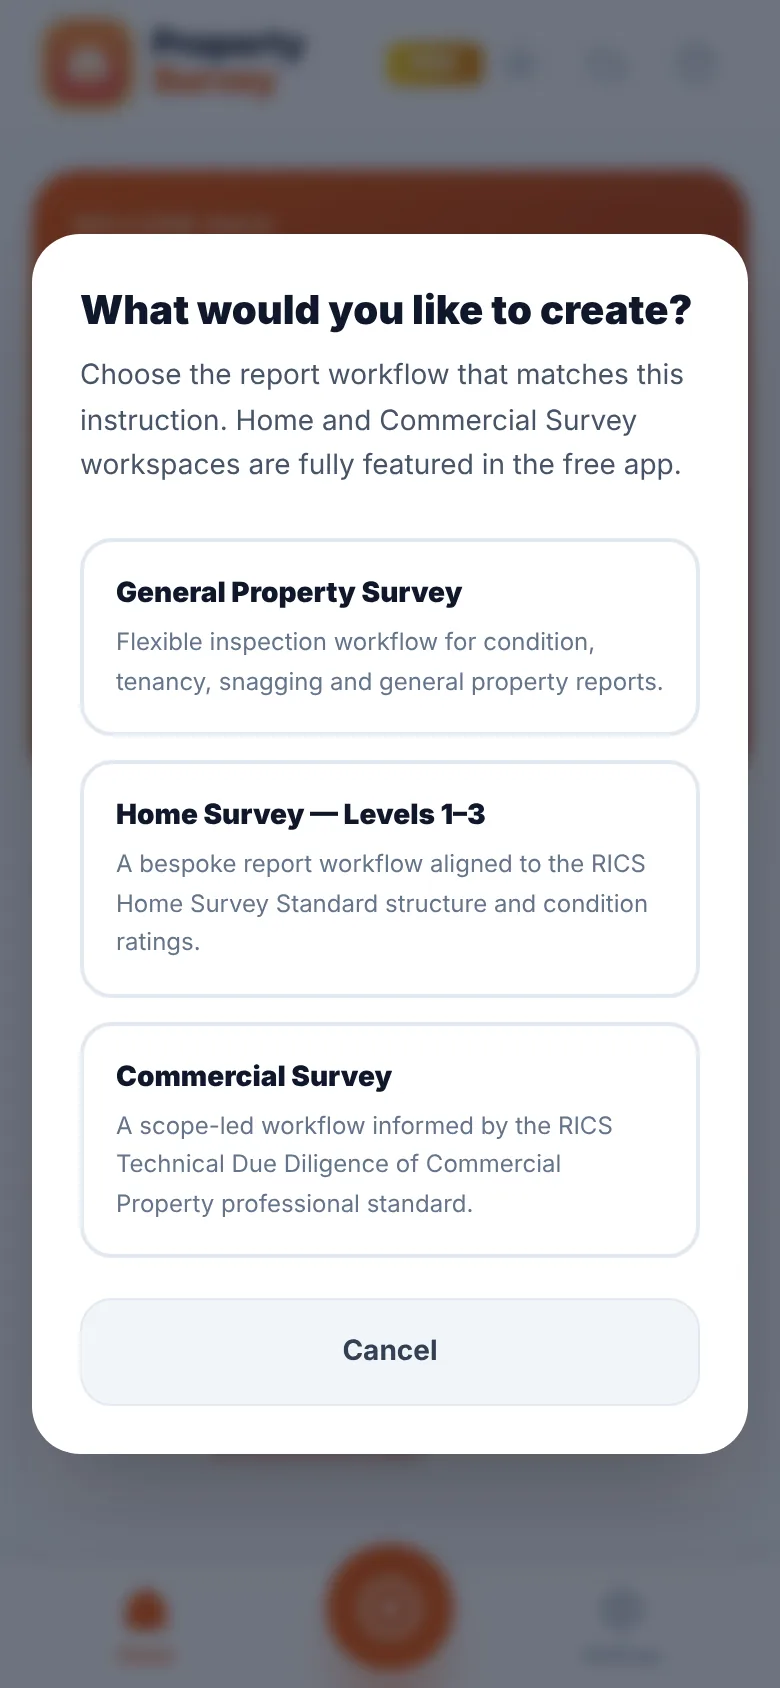
All three are free. Home and Commercial surveys have a “?” beside each section, field and rating with short guidance on what to record.
Your professional scope
PropertySurvey Pro is not endorsed, licensed or supplied by RICS and does not produce a RICS-branded report. Agree the scope, reliance, limitations and any specialist input with your client, and review every report under your own professional process before issue.
Where to find it:HomeRICS-aligned SurveyHome Survey — Levels 1–3
- In “A Instruction”, set the “Agreed Home Survey Level” and the instruction details.
- Record the property in “C About the property”.
- Work through “D Outside the property”, “E Inside the property”, “F Services” and “G Grounds”. Rate each element, add what you saw and photos. Levels 2 and 3 add repair, timing and further-investigation fields.
- Complete the overall opinion, legal matters, risks, declaration and next actions. If the client agreed a valuation or reinstatement cost, see Adding a valuation to a Home Survey.
- Open “Readiness & report”. It lists anything missing, such as unrated elements or a Not inspected rating without a reason. It warns but never locks you out.
| Rating | Meaning |
|---|---|
| CR1 | No repair currently needed |
| CR2 | Repair needed, not serious or urgent |
| CR3 | Serious or urgent repair or investigation |
| NI | Not inspected (say why) |
| Not rated | Element not rated in this report |
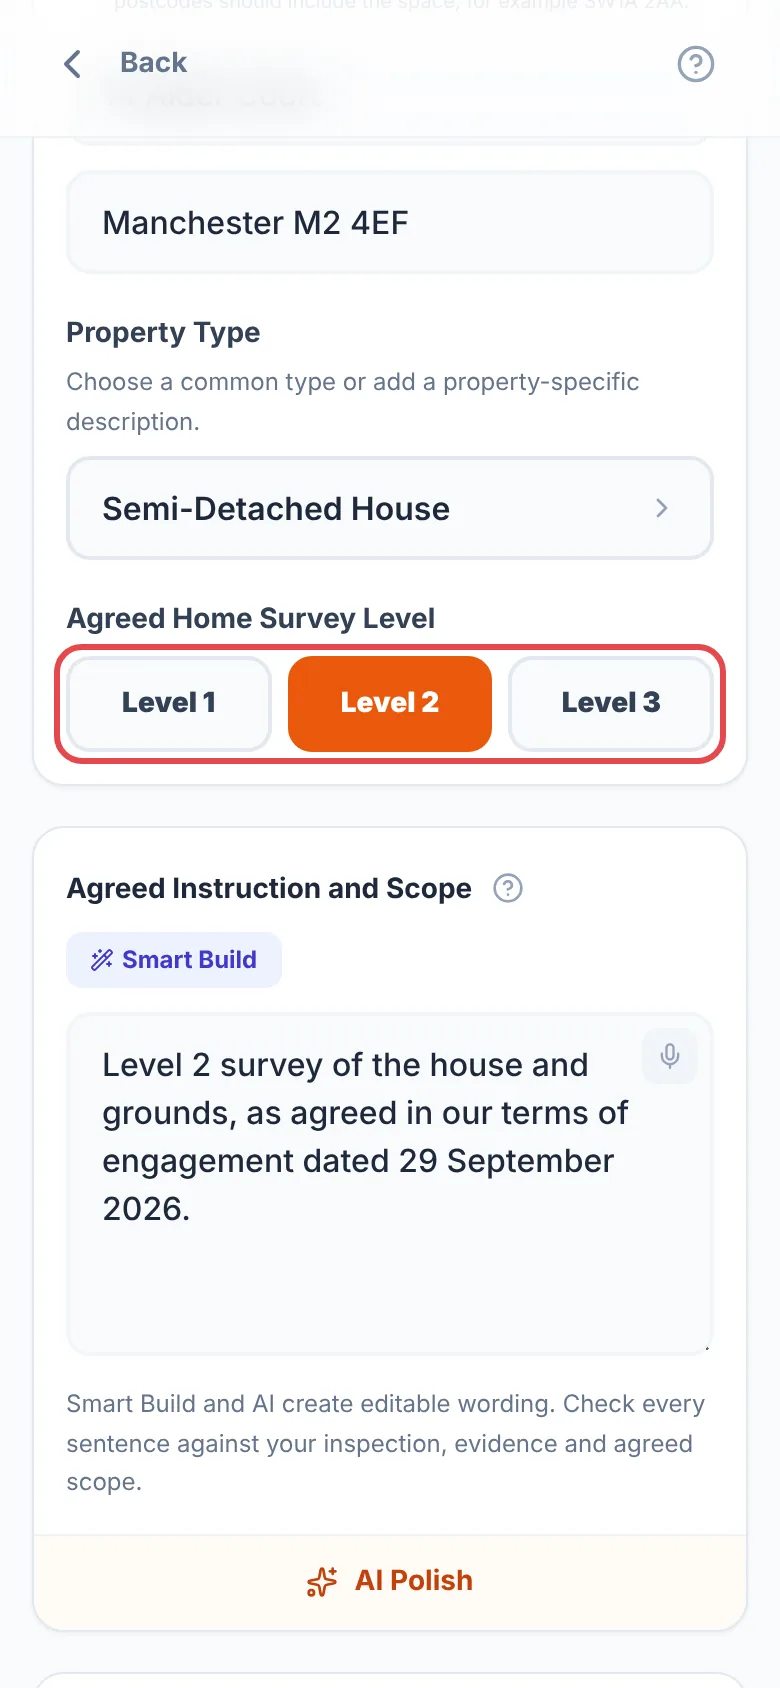
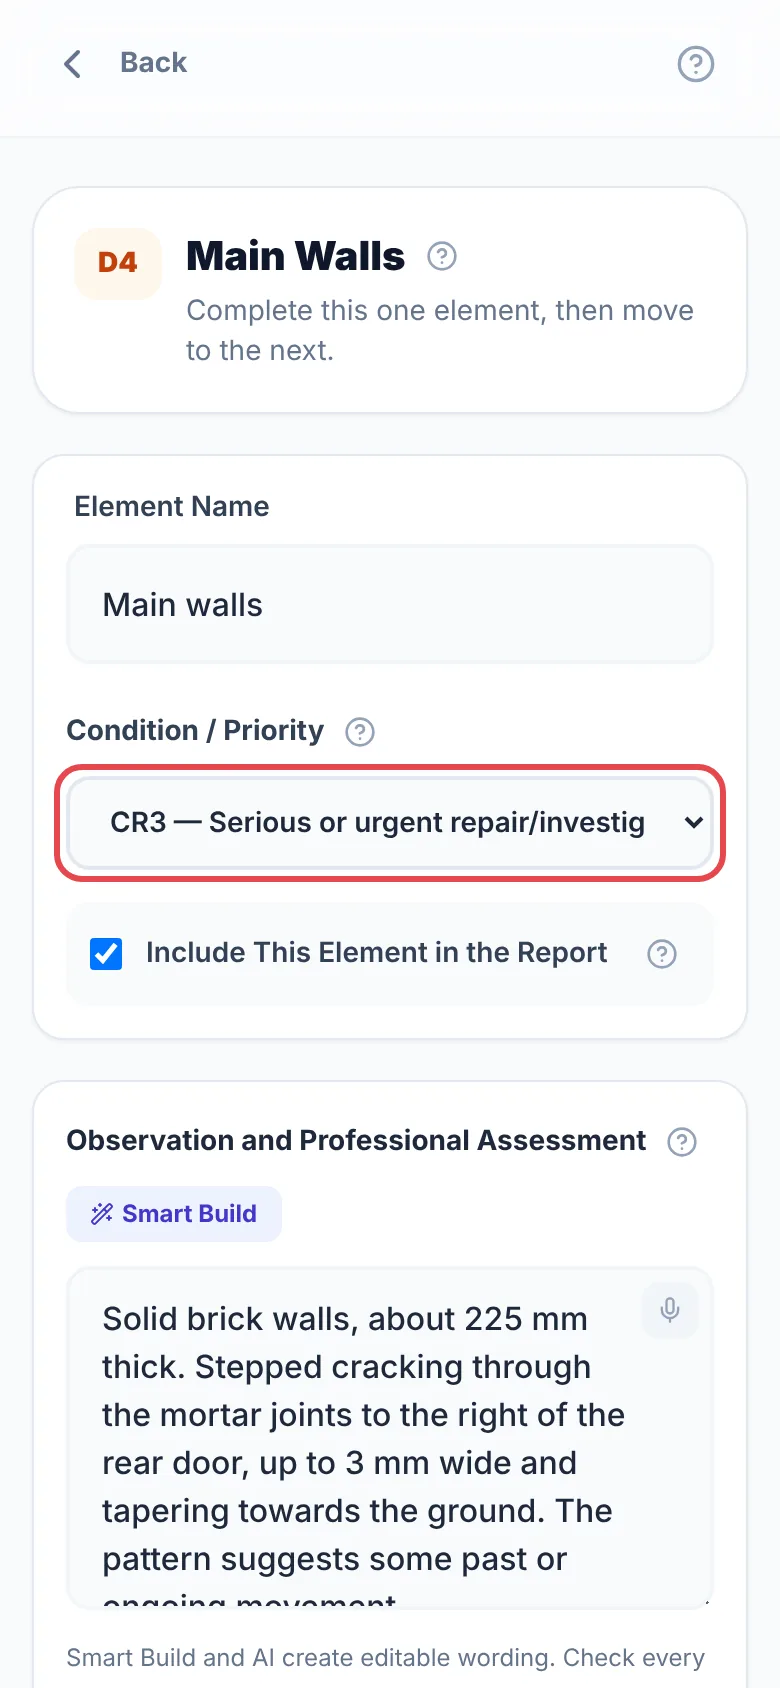
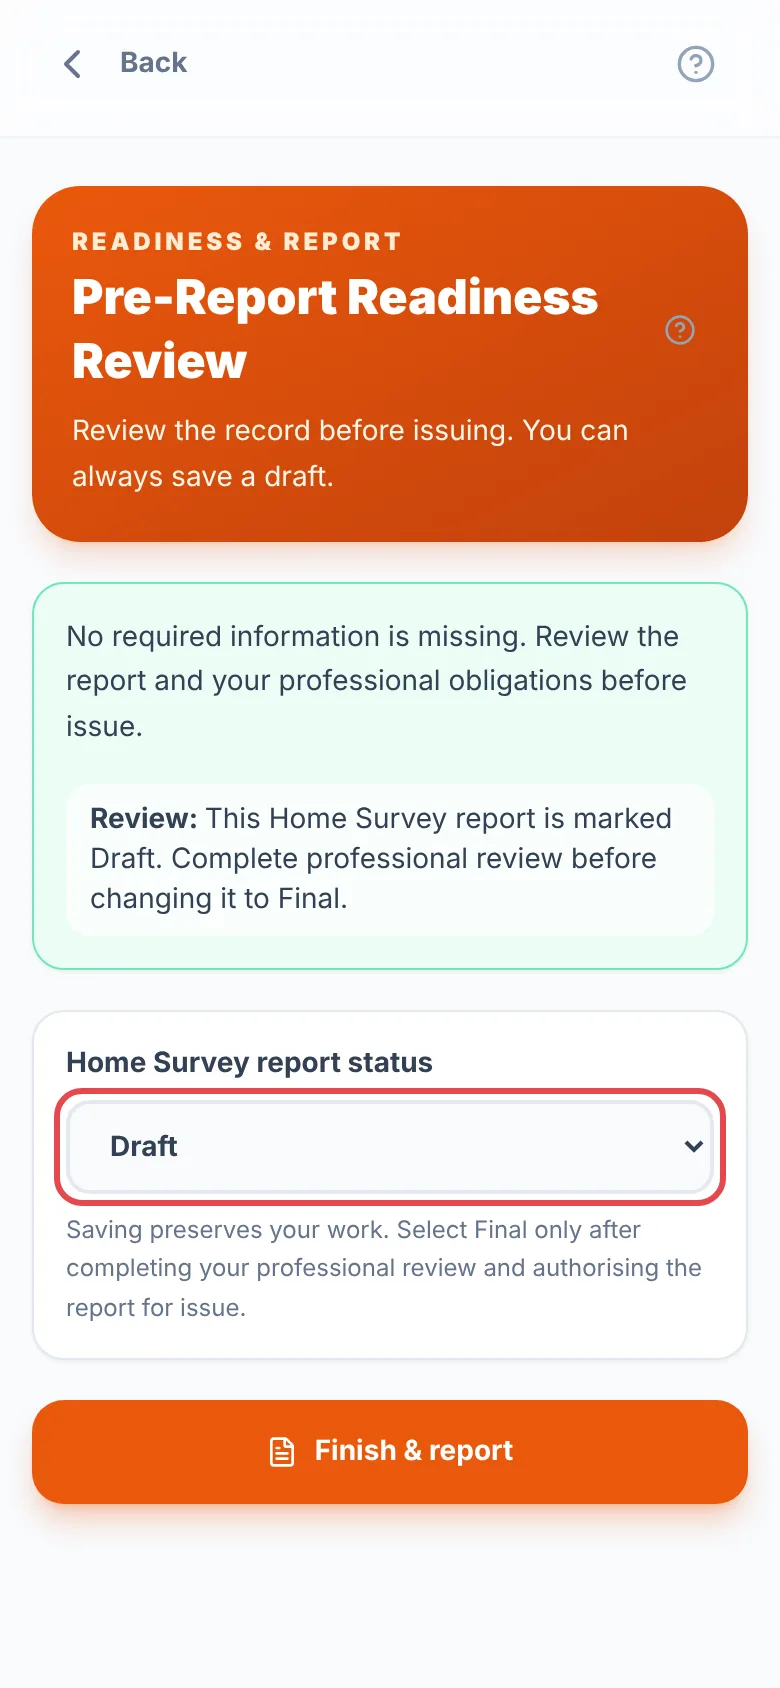
You can rename elements and add your own in each section. Reports start as Draft; change the status to Final only after your review, then tap “Finish & report”.
Independent software
PropertySurvey Pro is not endorsed or licensed by RICS and cannot grant a RICS report licence. RICS says members and regulated firms need a licence to produce branded RICS Home Survey reports. Use the workspace as your own evidence and reporting tool.
Where to find it:Home SurveyA InstructionAdditional Services
A market valuation and an insurance reinstatement cost are optional services you can add to a Home Survey at any level. Both are off for every new survey and are free to use.
- In “A Instruction”, switch on “Market Valuation”, “Insurance Reinstatement Cost” or both, matching what the client agreed in your terms of engagement.
- A new step, “J Property Valuation”, appears after the risks. The declaration moves to K and further investigations and next actions to L. With both switched off, the report keeps its usual letters.
- In “Market Value”, record the purpose and valuation date, then choose how the value is reported: “Report it here”, “Withhold it” until further investigations are complete, or “Separate report”.
- Record the tenure (and the lease details for a leasehold), the floor area and how it was found, and untick any standard assumption that does not apply, saying why.
- Add any special assumptions, your valuation approach and market commentary, and your comparable evidence. Tick “Print the comparables in the report” to show them in the report; otherwise they stay in your file.
- If market conditions call for it, switch on “Report Material Valuation Uncertainty” and write your statement.
- For a reinstatement cost, enter the figure, how it was calculated and what it includes and excludes.
- In “Valuer”, add your RICS membership number and confirm the statements that apply. Your Registered Valuer status also prints under your sign-off.
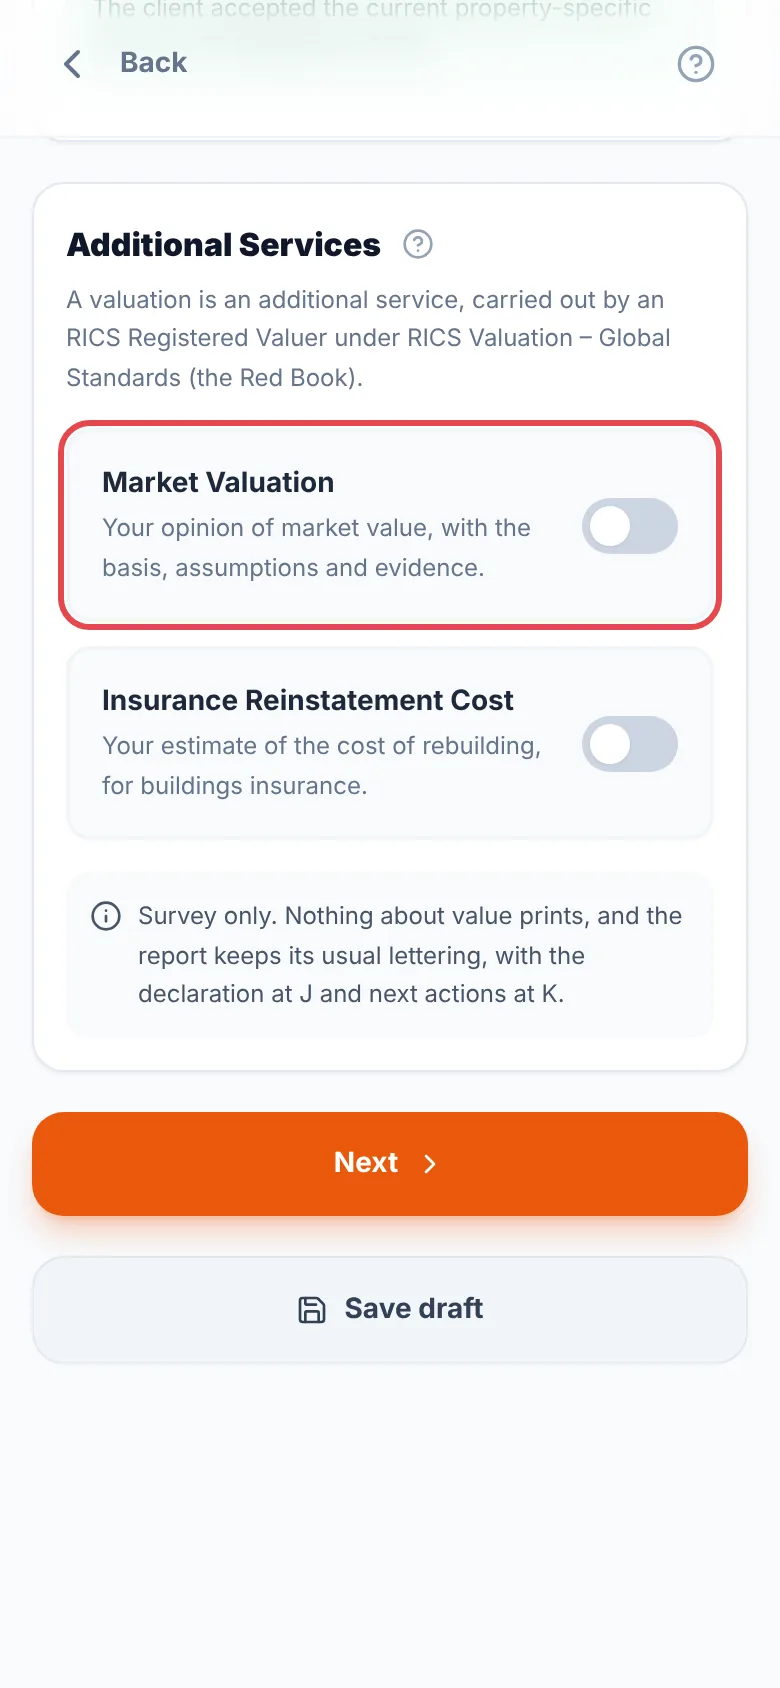
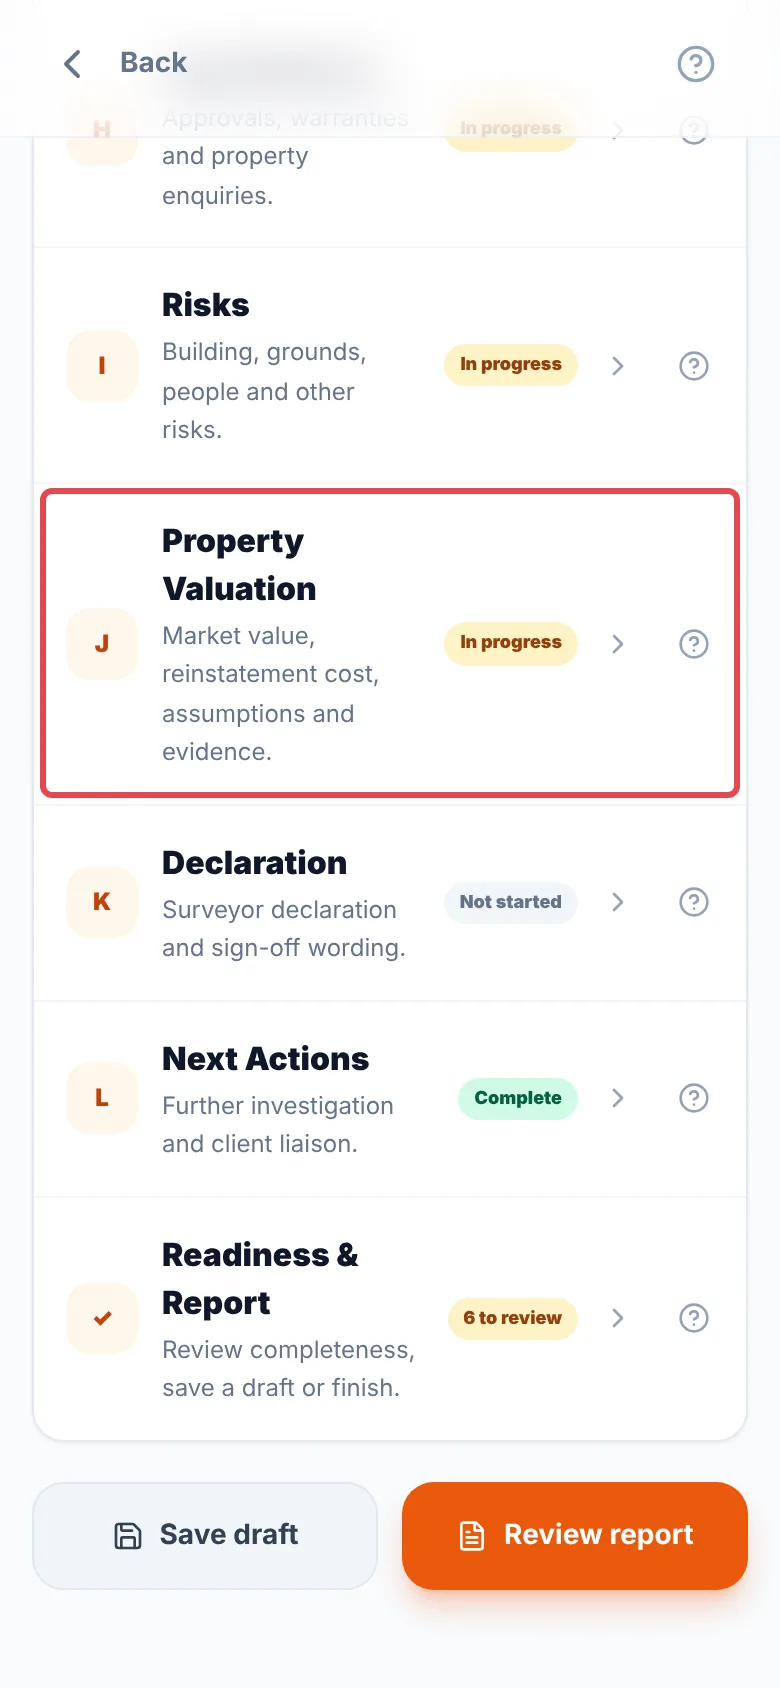
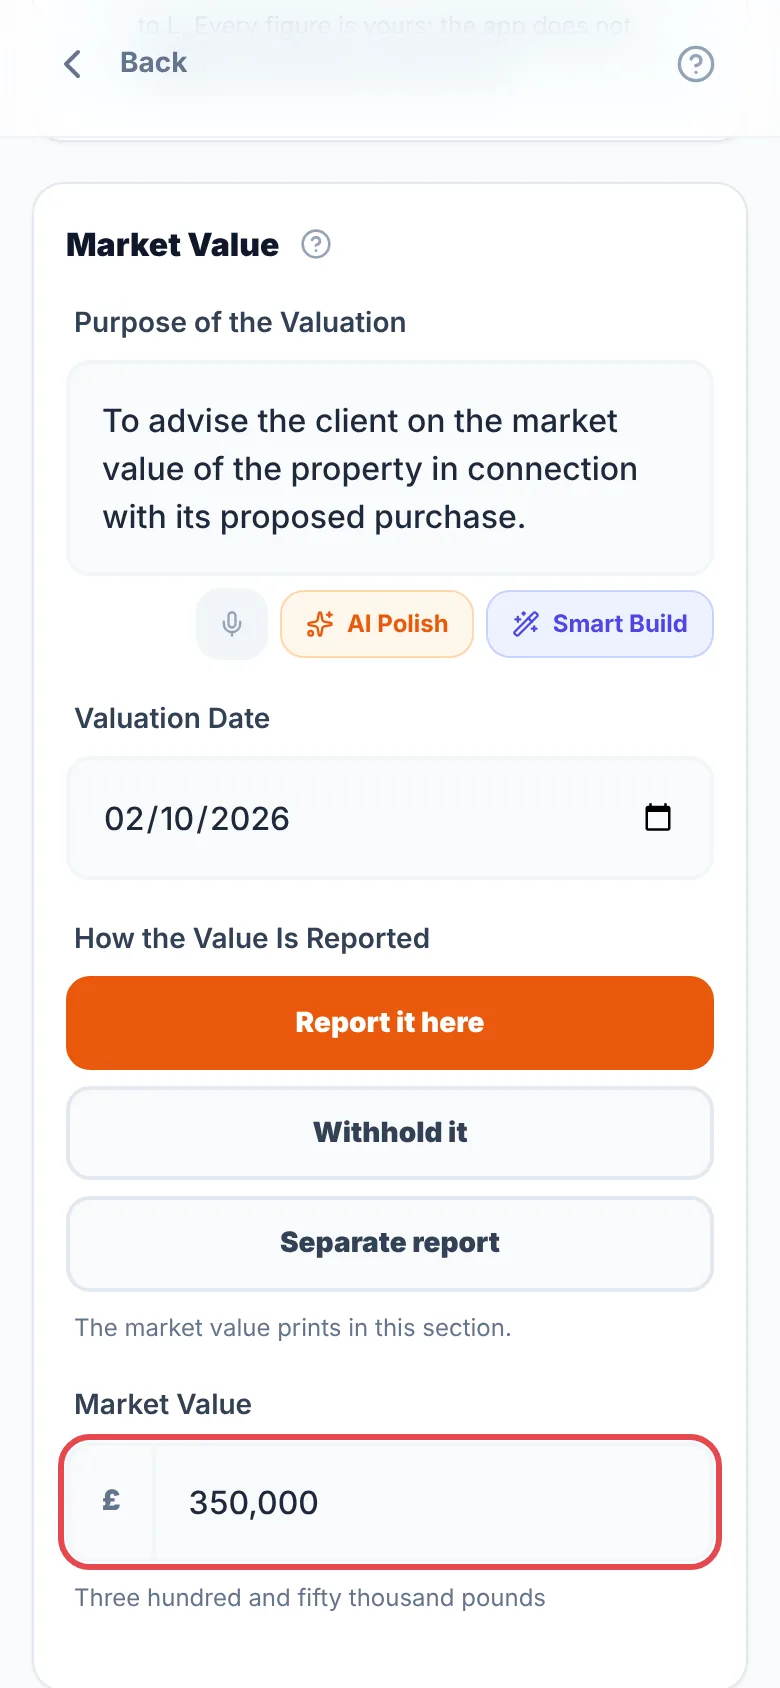
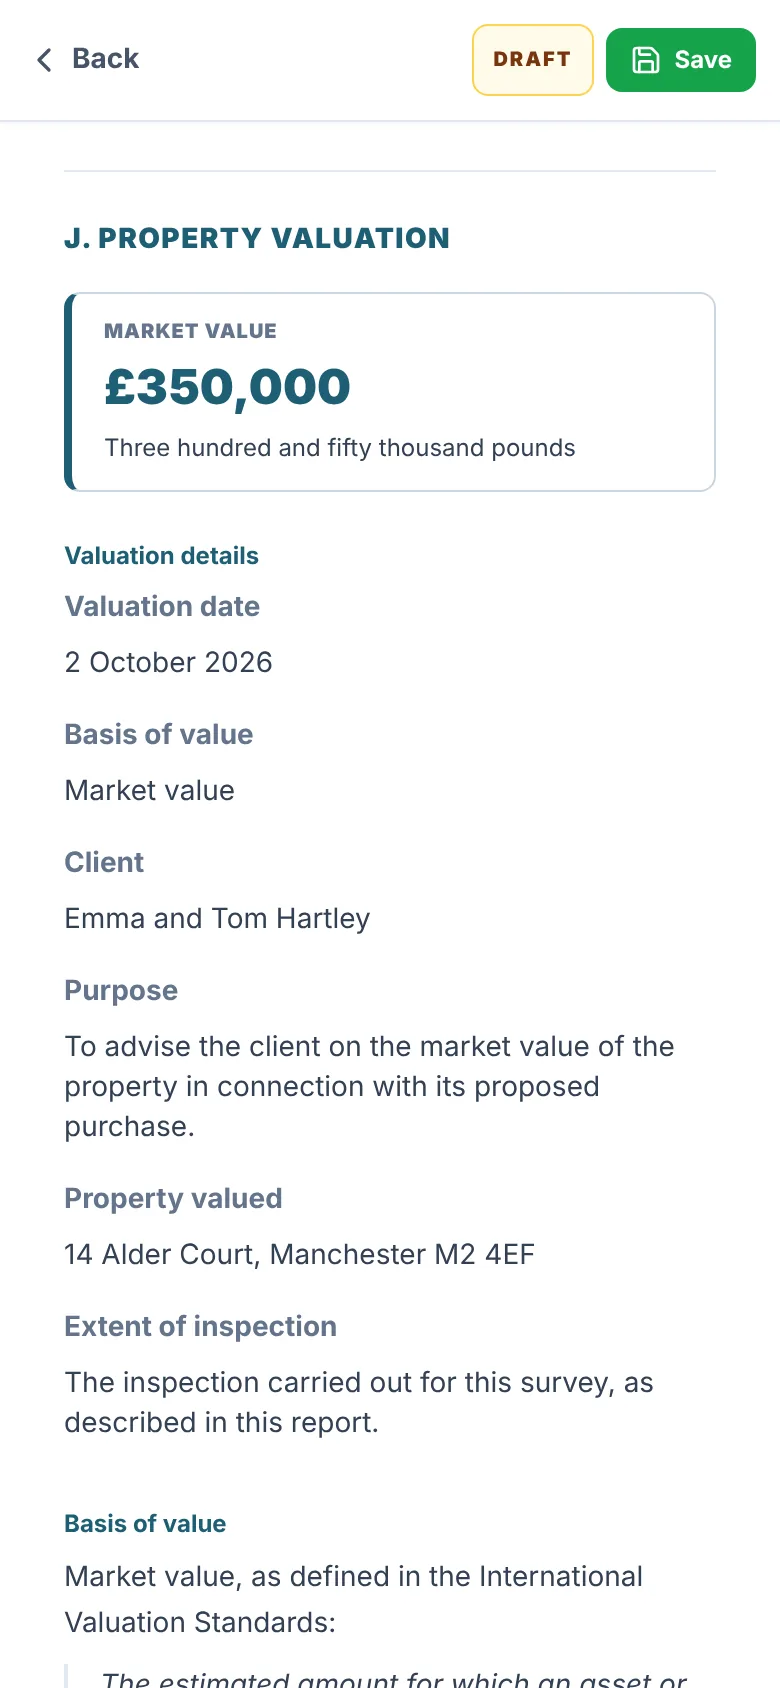
Figures print in the report in your report currency, in figures and in words. “Readiness & report” lists anything a valuation report needs that is still missing, and warns if CR3 items or further investigations are open while a value is reported.
Your valuation, your responsibility
The app never suggests, calculates or checks a figure. Smart Build and AI Polish help with the wording; AI Polish keeps every figure you wrote and will not add one. A market valuation must be carried out by an RICS Registered Valuer in line with RICS Valuation – Global Standards (the Red Book) and your terms of engagement.
Where to find it:HomeRICS-aligned SurveyCommercial Survey
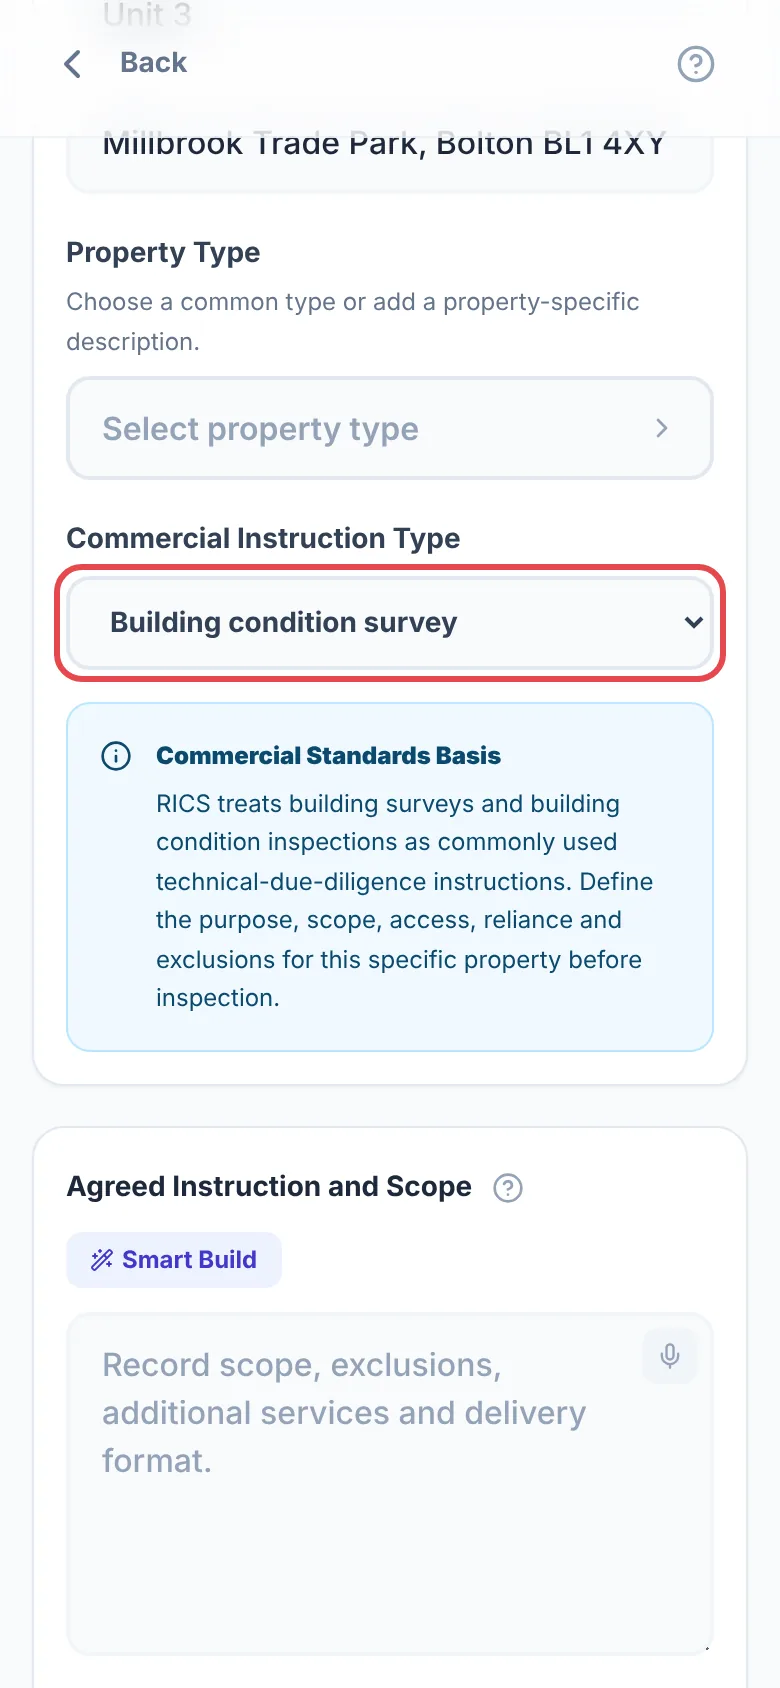
- In “1 Instruction & reliance”, choose the “Commercial Instruction Type”: building condition survey, technical due diligence, or schedule of condition. Record the purpose, scope, reliance and any urgent safety matters.
- In “2 Property, access & information”, record access, documents and specialists.
- Work through the schedule: “A Site, access and grounds”, “B Structure and external envelope”, “C Internal construction and fit-out”, “D Building services” and “E Compliance and property records”. Give each element a priority and add notes and photos.
- Complete “S Summary, risks & actions” and the declaration, then open “Readiness & report”.
| Priority | Meaning |
|---|---|
| P1 | Serviceable, routine maintenance |
| P2 | Planned repair or further review |
| P3 | Urgent or significant action |
| NI | Not inspected (say why) |
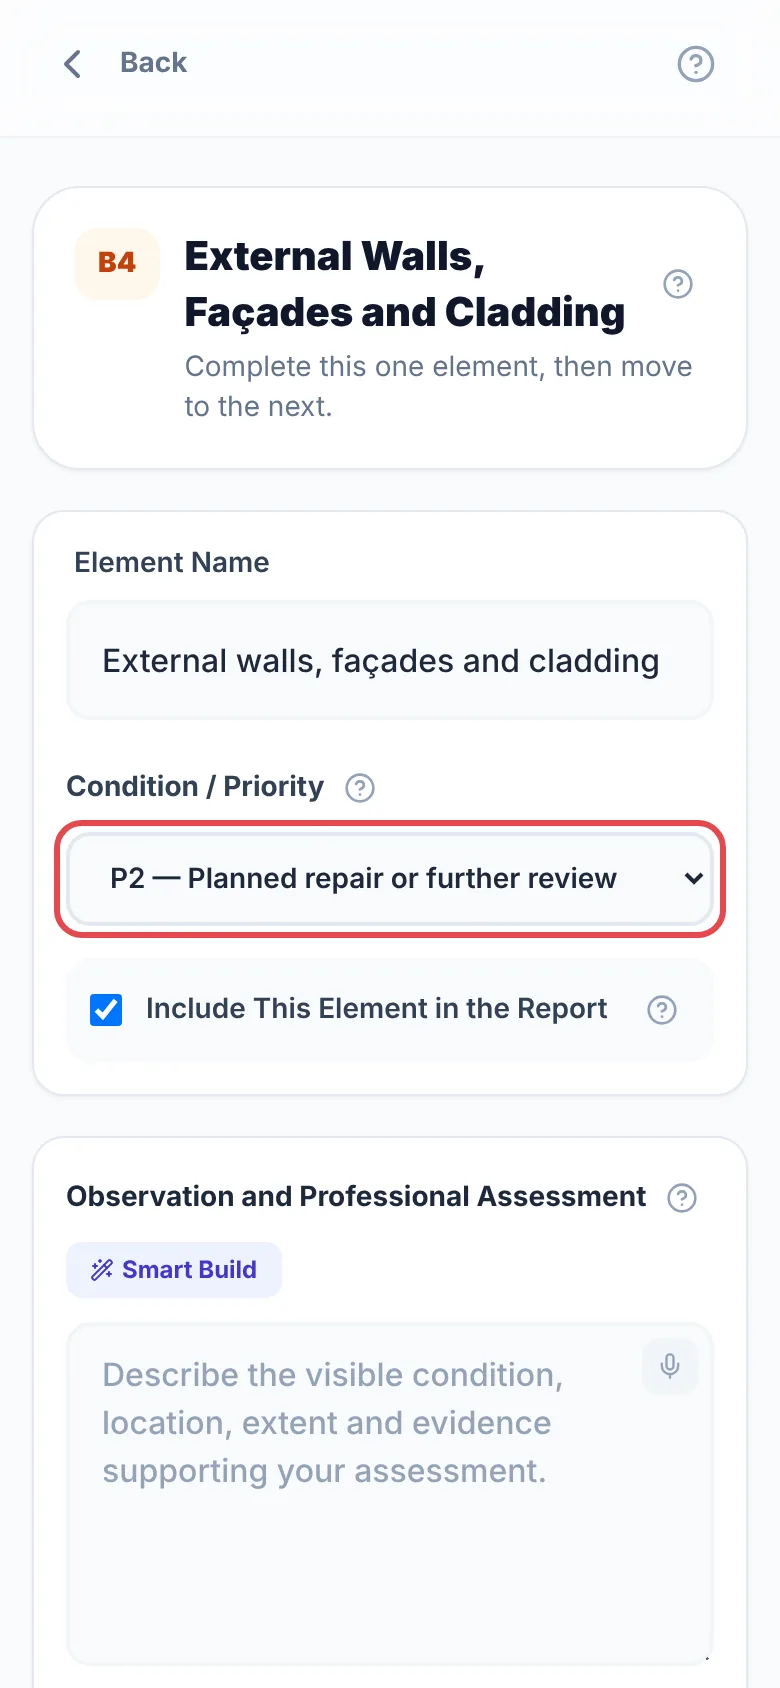
A schedule of condition is a factual record of condition on the day. It does not become technical due diligence, a schedule of dilapidations or a legal opinion. Keep the report as Draft while checking it, and change it to Final only after review.
Building a General Inspection
Each section of a General Inspection, in the order you are likely to use them.
Where to find it:Homea finished surveyStart follow-up visitor the same button at the bottom of the report
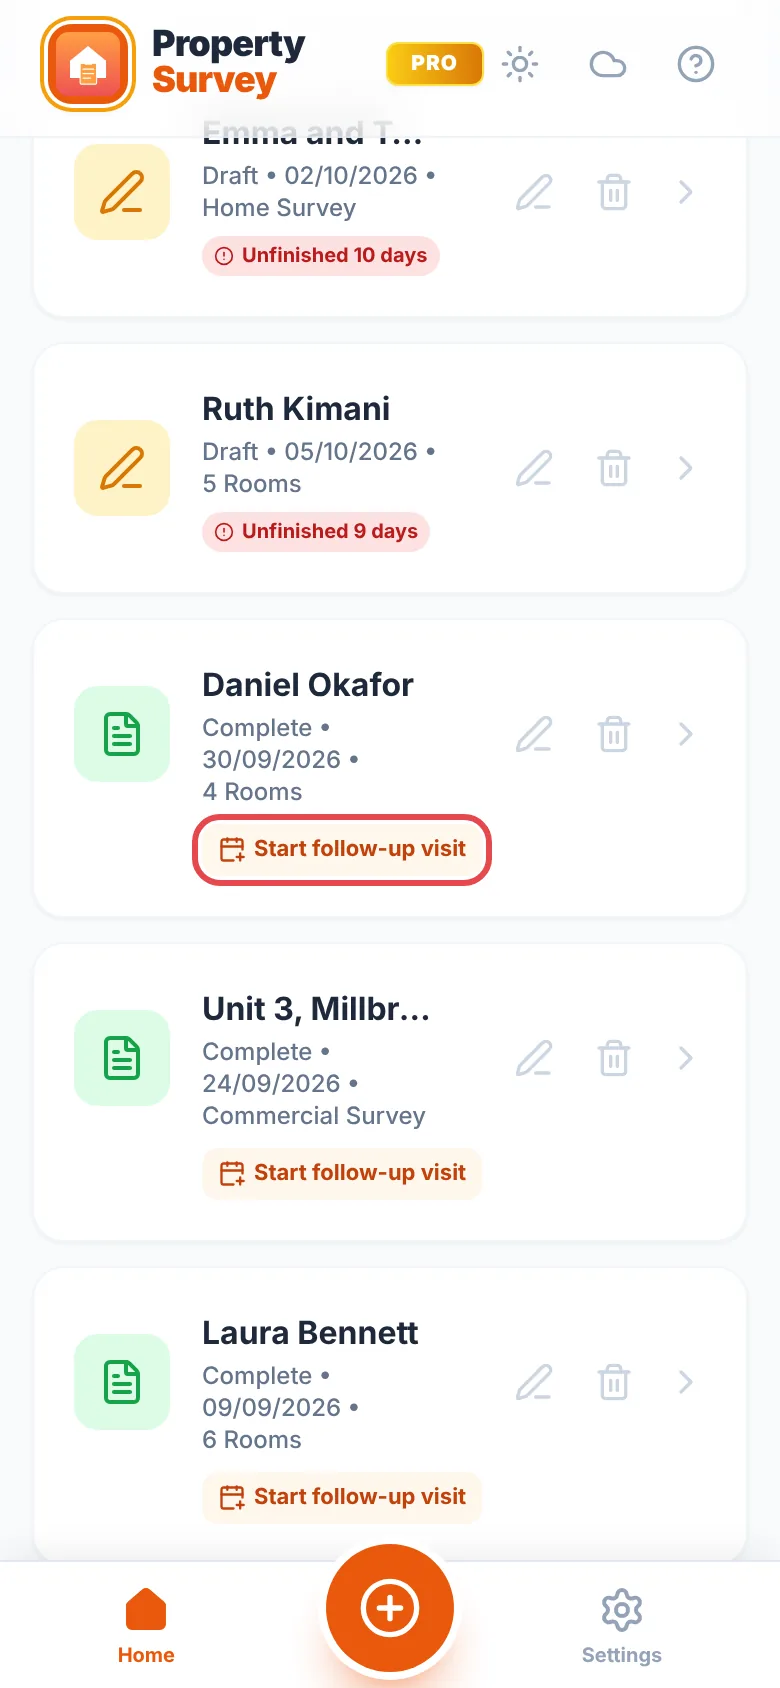
Going back to a property? Start a follow-up visit instead of a new survey, so you do not type the same details twice. It works for General Inspections, Home Surveys and Commercial Surveys.
- On the home screen, find the finished survey and tap “Start follow-up visit”.
- The app makes a new draft of the same survey type, dated today, with the same reference plus -V2 (then -V3, and so on).
- Work through the survey as usual. Under each reading and rating you see what it was last time, so you can record what you find today.
- Copied across: the client and property details, rooms and outside areas, the list of survey elements, the floor plan, the planning check and your report wording.
- Starts empty: readings, condition ratings, element ratings, photos, notes and the signature.
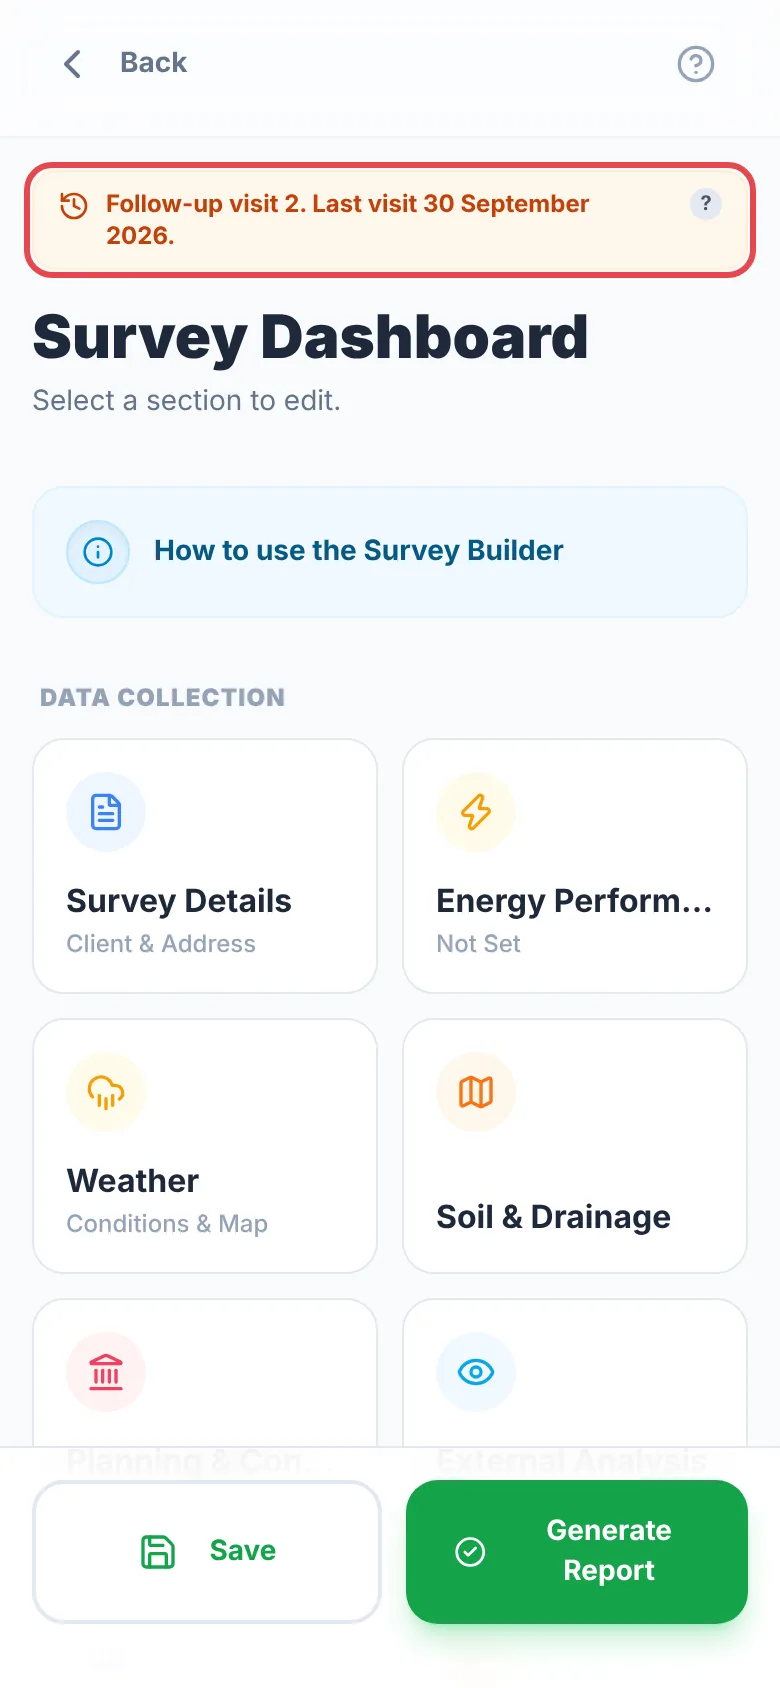
- A banner at the top shows which visit this is and the date of the last one.
- The report and PDF say Follow-up visit 2 under the title and name the previous visit's date and reference, in every report layout.
Changes since last visit PRO: the report and PDF add a section showing each room's readings and condition ratings then and now, element ratings that got better or worse, and before-and-after photos. Rooms you did not revisit are left out, and new rooms are marked New.
The follow-up is its own survey. Deleting the earlier one keeps the comparison table but removes its photos from it.
Wherever you see a “Photos” area or a camera icon, tap it and choose:
- “Take Photo” to use the camera.
- “Photo Gallery” to pick up to 10 photos you have already taken.
- “Browse Files” for JPG or PNG photos saved in Files or a cloud drive.
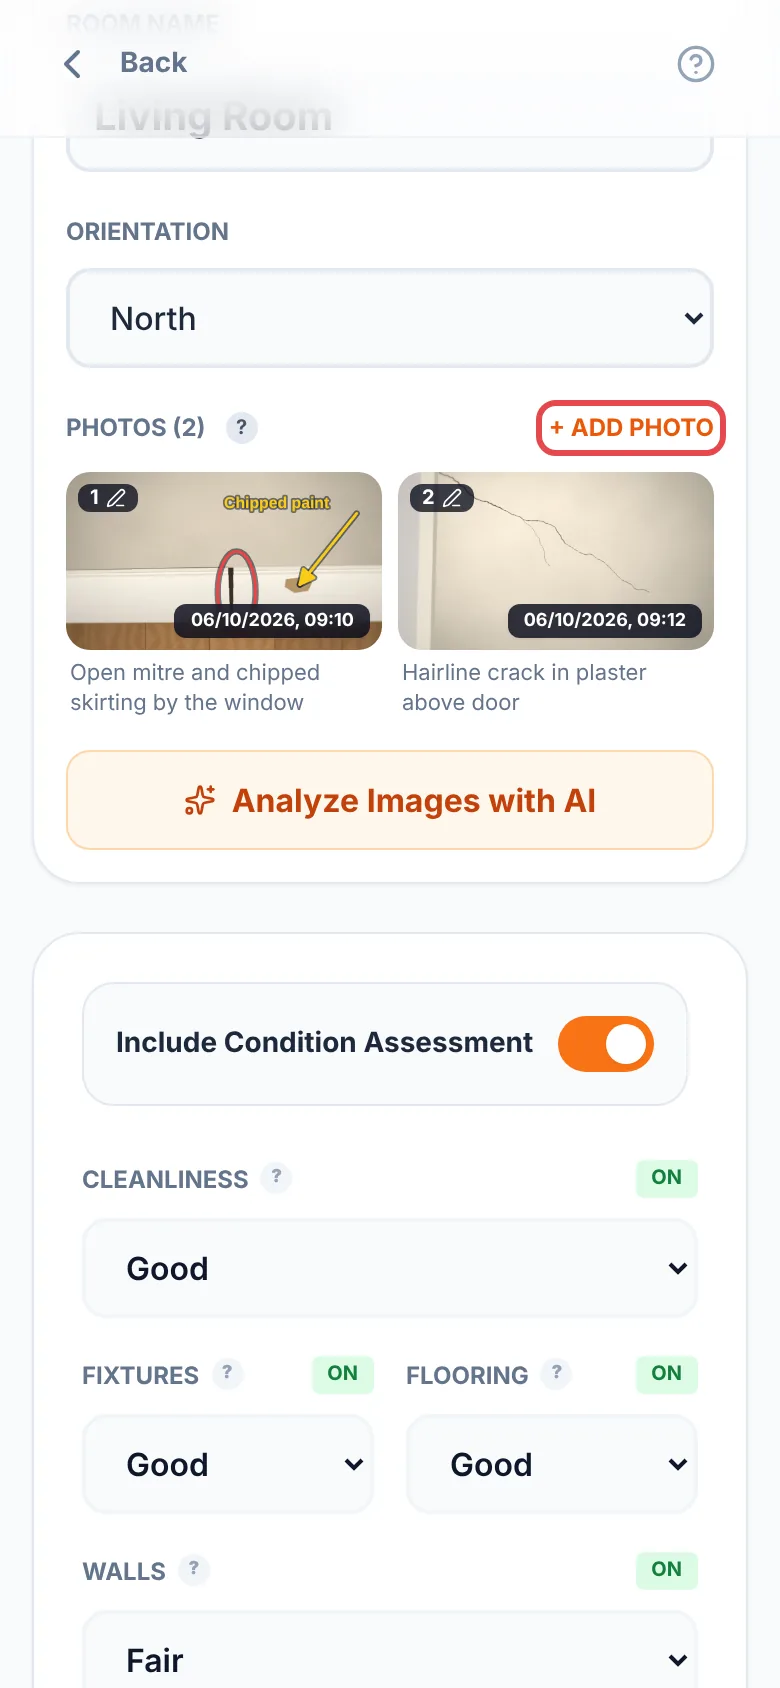
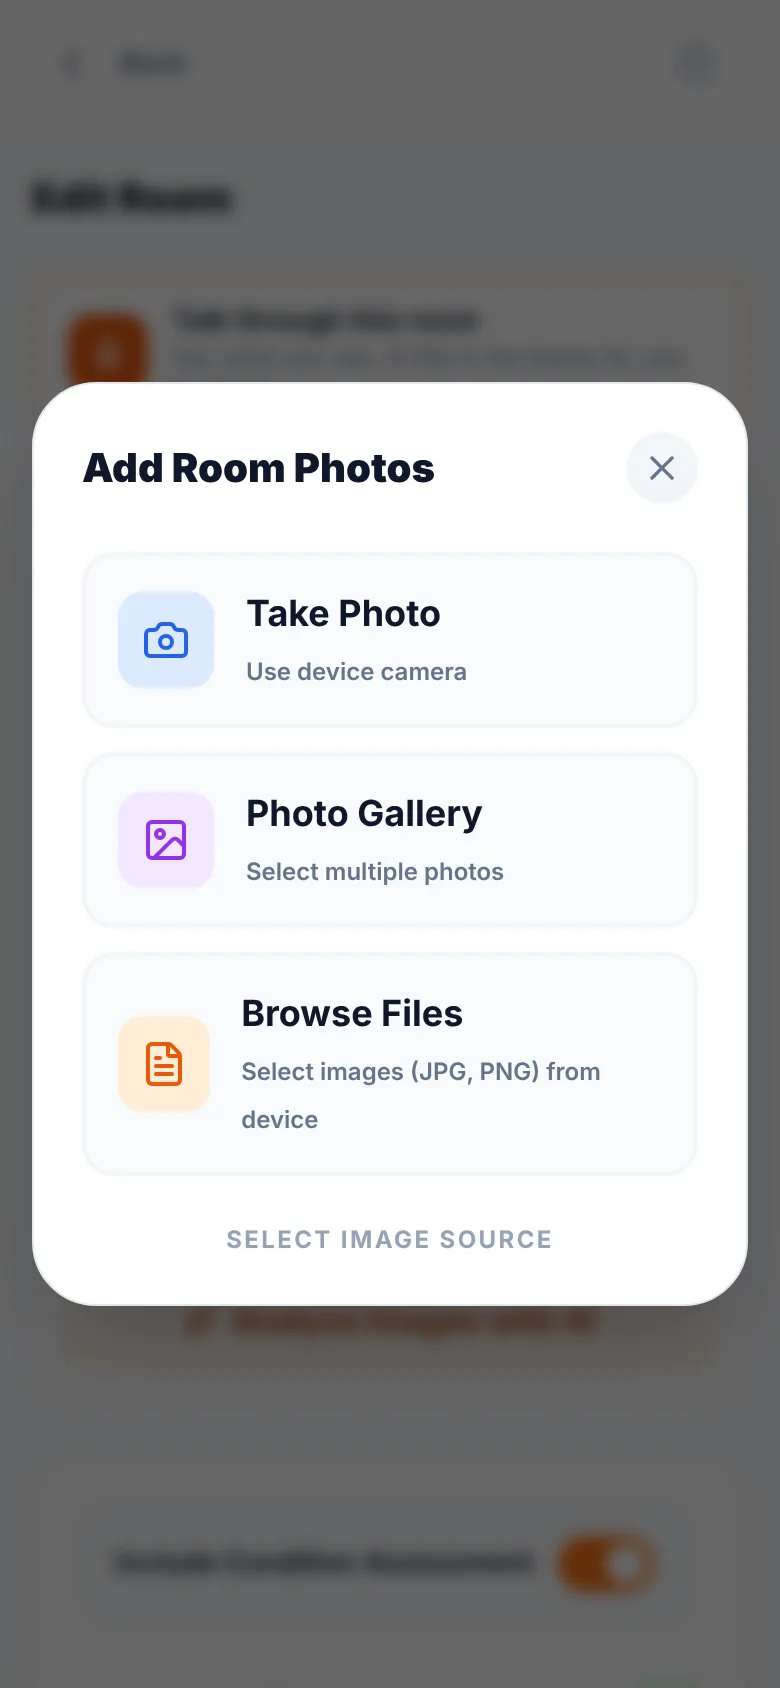
The first time, your phone asks for permission to use the camera or photos. Tap Allow. If you said no by mistake, turn it on in your phone's Settings app under PropertySurvey Pro.
Tap a photo once it is added to give it a caption or mark it up (Photo captions and markup). Pro can stamp the date and time on photos (Photo timestamps).
Where to find it:Open a surveya room, outside area or survey elementtap a photo
- Tap any photo in a room, an outside area, or an element of a Home or Commercial survey to open it full size. Just after you add a photo, a “Photo added. Mark it up?” bar shows for a few seconds: tap “Mark up” to open that photo straight away (it stays hidden when tips are turned off in Settings).
- Caption (free): type or dictate a short note about what the photo shows.
- Markup PRO: tap “Circle”, “Box”, “Arrow”, “Draw” or “Label”, pick a colour and a thin, regular or thick line, and drag on the photo. “Number” drops numbered pins (1, 2, 3) you can refer to in your caption.
- Change a mark: tap “Select”, then tap a mark to move it, change its colour or line, or “Delete” it. “Undo” takes off the last change and “Clear” takes all the marks off.
- Zoom: pinch the photo to zoom in for fine detail. With no tool picked, drag to look around; “Fit” zooms back out.
- Tap “Save”. The “X” at the top and the phone's Back button save too; “Cancel” leaves without saving.
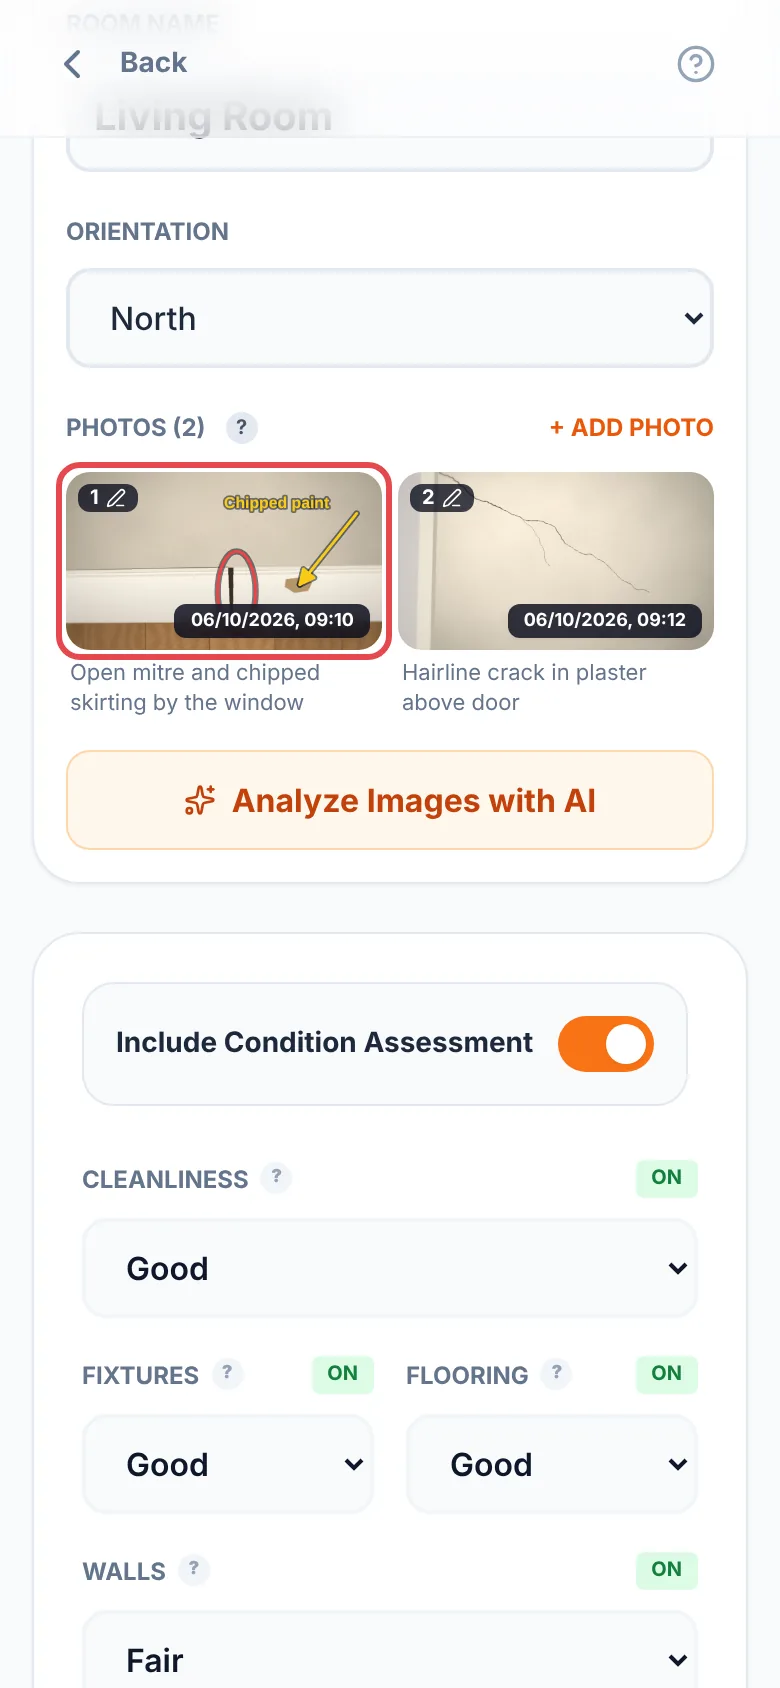
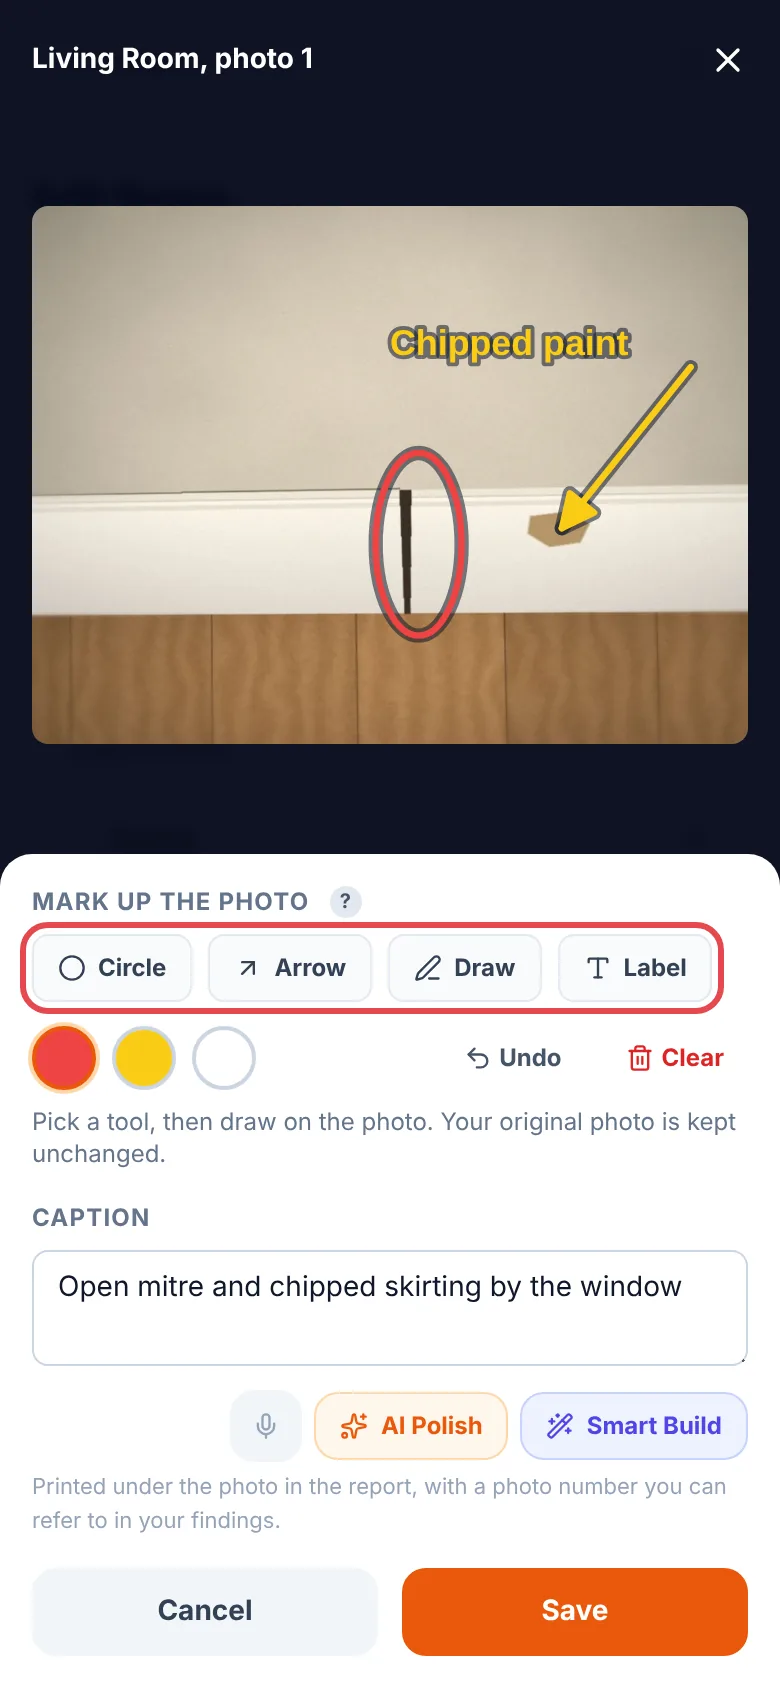
Once any photo in a room, area or element has a caption, the report numbers its photos and prints the captions under them, such as Photo 2: Cracked render above the bay window, so your written findings can refer to them. Anything with no captions looks exactly as before.
Your markup is drawn over the photo, not saved into it, so the original photo is kept untouched as your evidence. If you stop paying for Pro, markup you already added still shows in the report, and you can remove it.
Where to find it:Open a General InspectionRoom AnalysisAdd Room
Add one entry for each room you inspect, then record:
- Condition of the cleanliness, fixtures, flooring and walls.
- Damage notes and any maintenance required.
- Photos: a wide shot for context plus close-ups of each defect.
- Temperature and humidity, if you tick “Include Atmospheric Readings”.
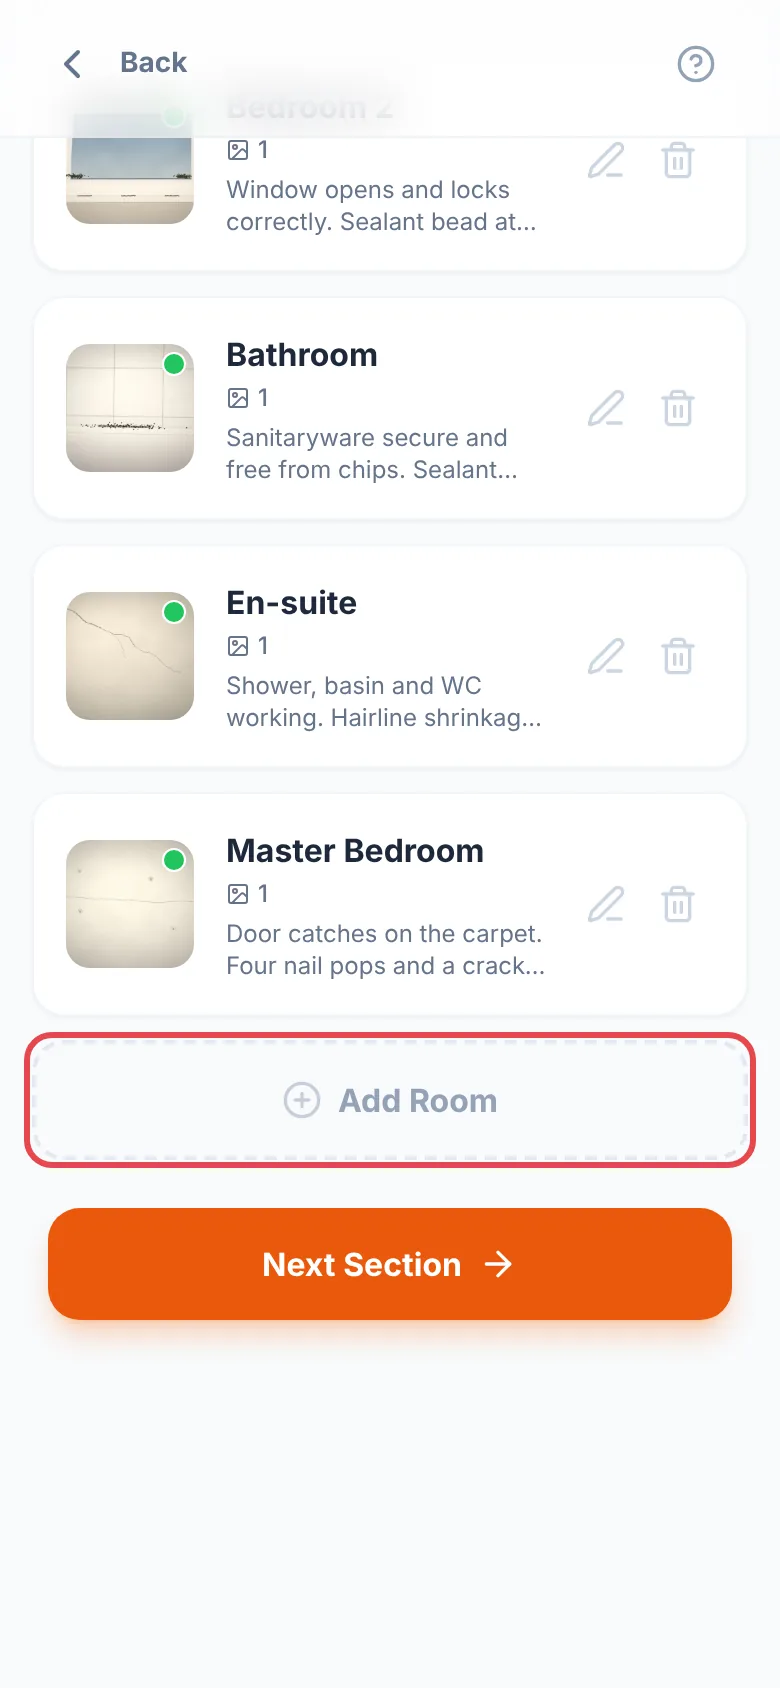
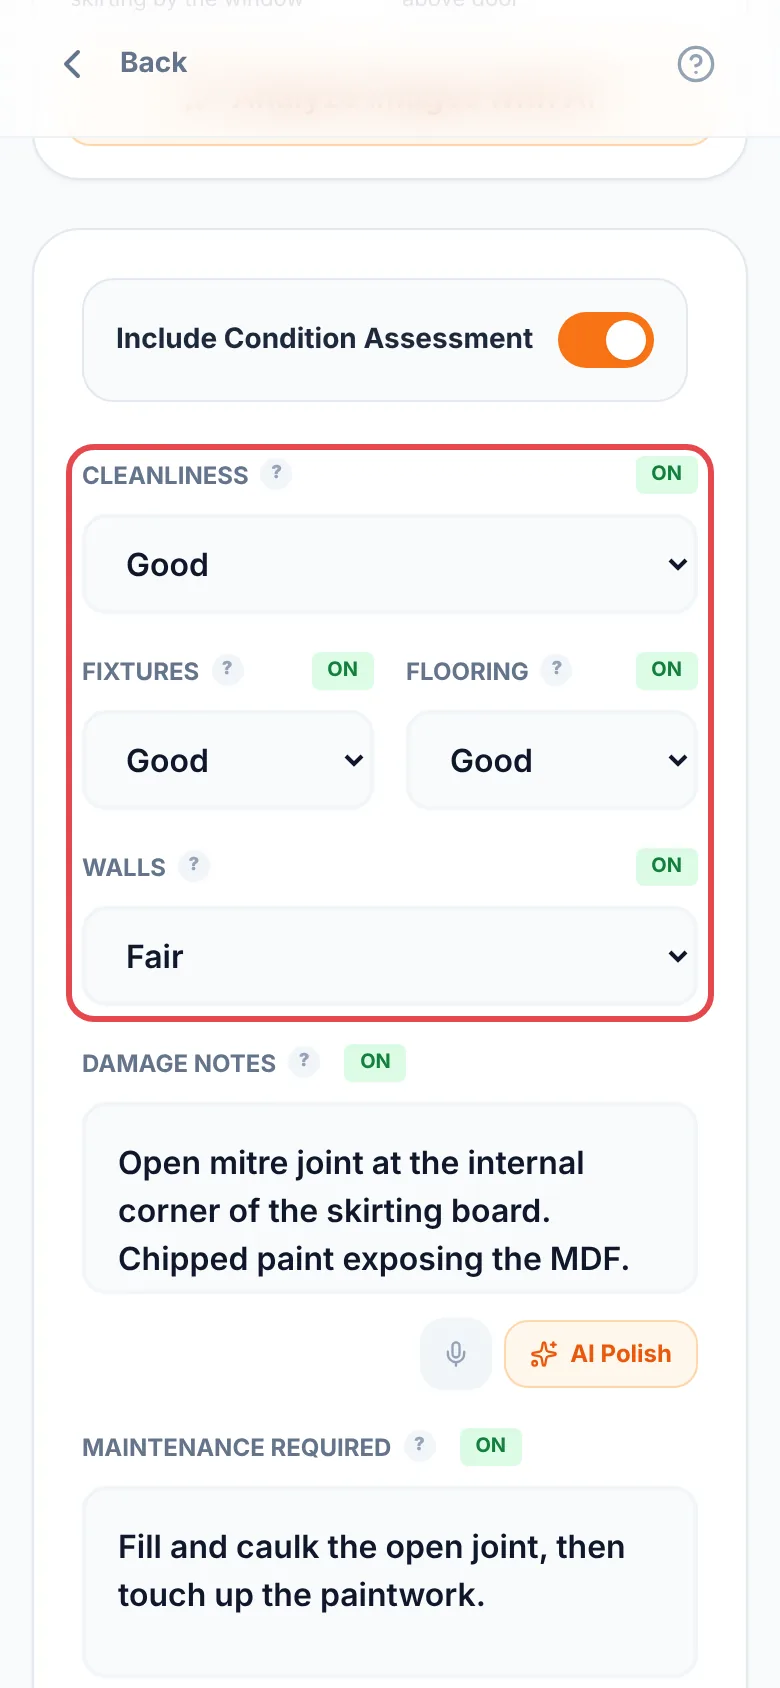
Type, dictate with the microphone, or tidy your notes with AI Polish. Tap “Analyse Images with AI” for a suggested description of a photo (AI Polish and photo analysis).
Where to find it:Open a General InspectionExternal AnalysisAdd External Area
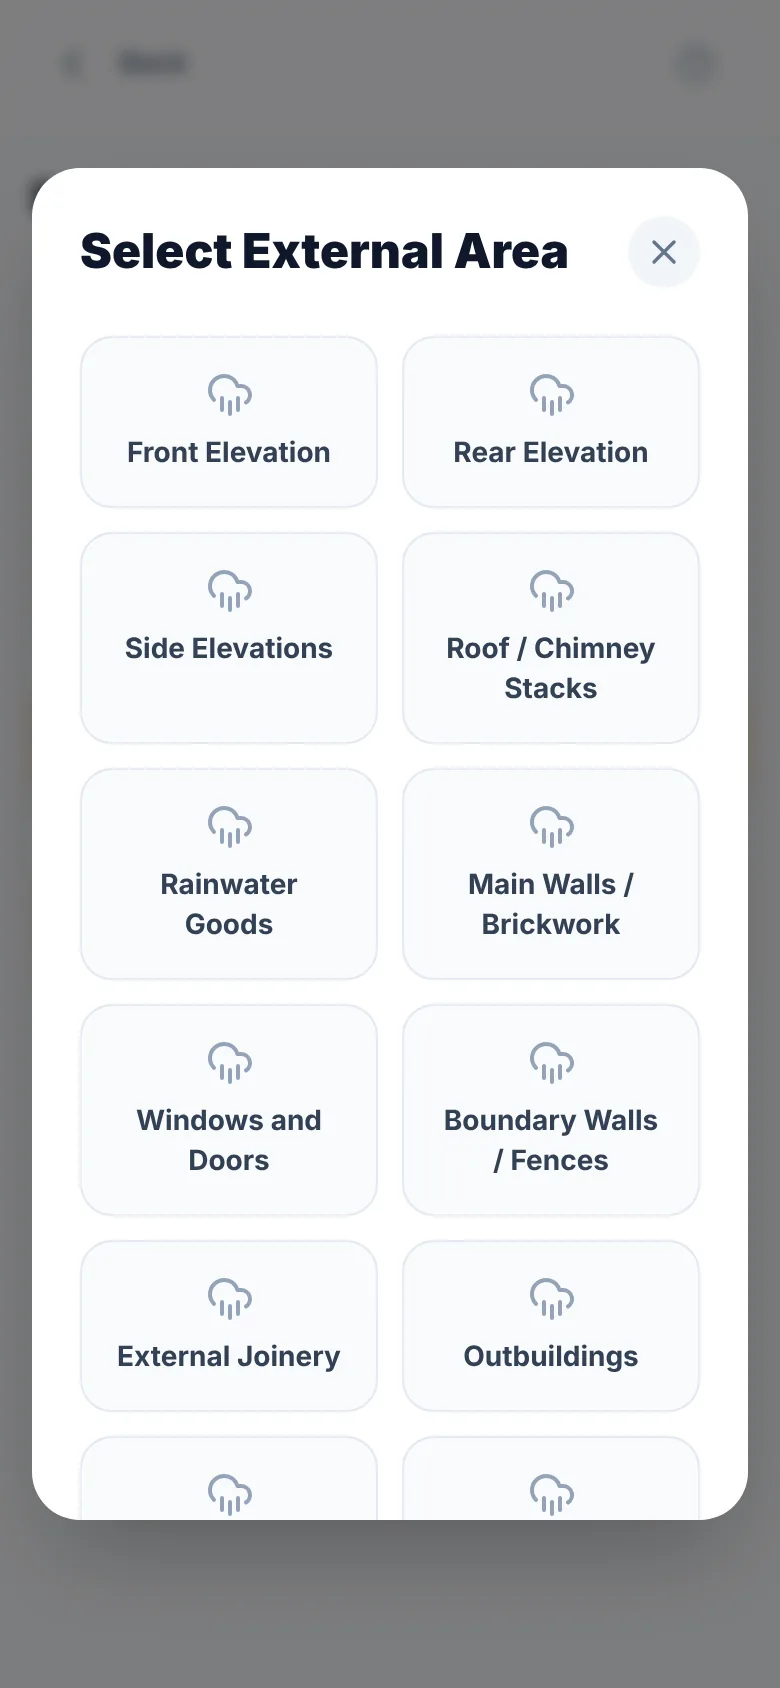
Add each area you inspect: pick “Front Elevation”, “Rear Elevation”, “Side Elevations”, “Roof / Chimney Stacks” and so on, or name your own. Rate the roof, guttering, walls, windows, doors and ground level, and record defects such as cracked render or slipped tiles with photos.
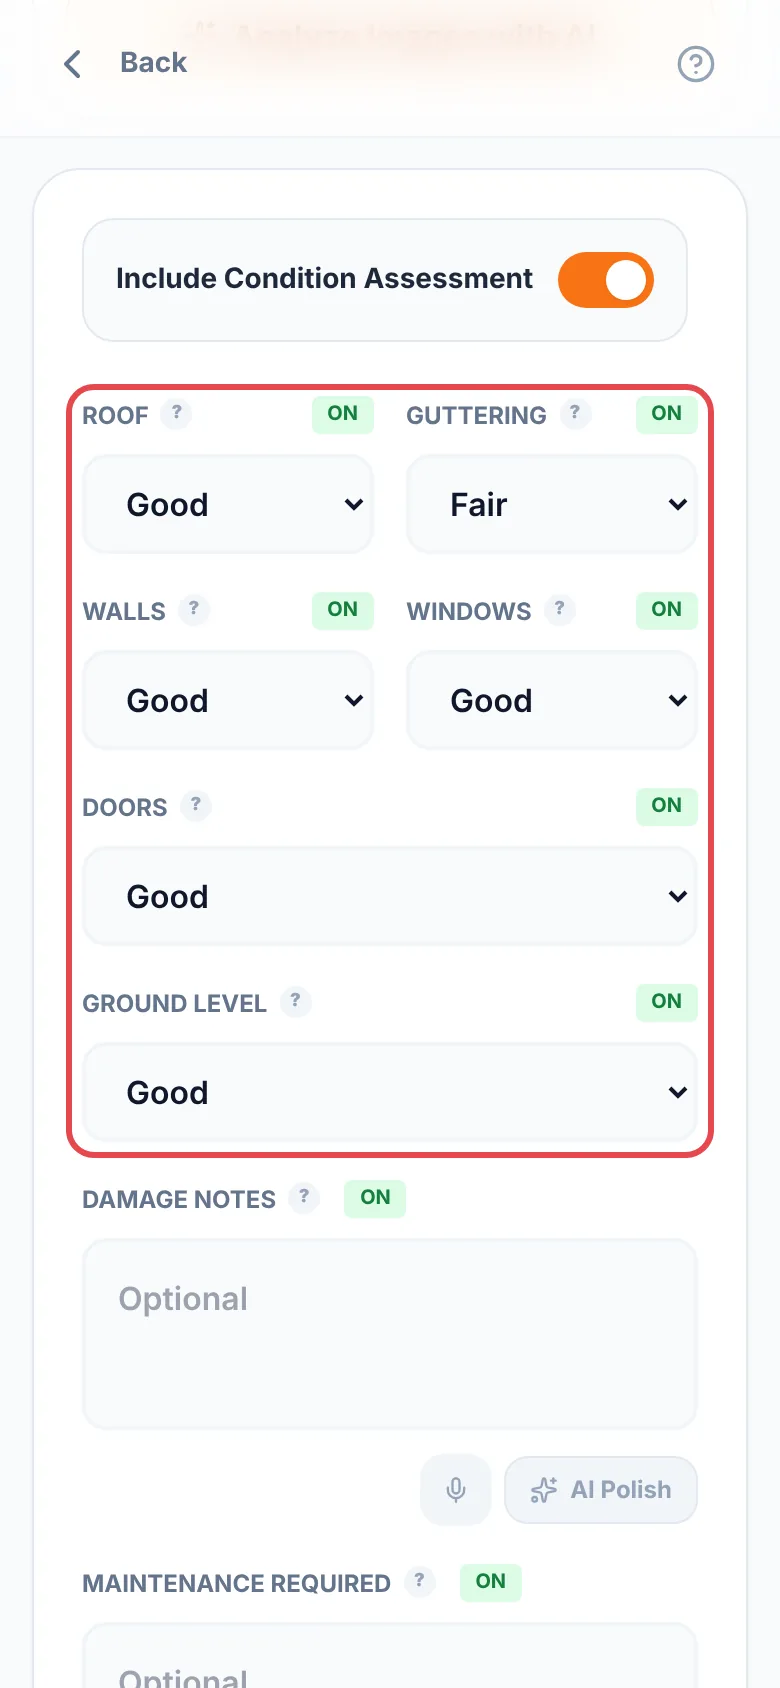
“Analyse Images with AI” suggests a description of a photo. Free includes 3 uses a month; Pro can use it daily. Always check what it says against what you saw.
Where to find it:Open a General InspectionExternal Analysis or Room Analysisan area or roomArea Checklist
Every outside area and room in a General Inspection has a checklist of the possible defects there and the checks to carry out, grouped by element, so nothing gets missed and every report records what was inspected. It is free.
- In External Analysis or Room Analysis, tap “Add the standard areas” (or “Add the standard rooms”), untick any the property doesn't have, and tap “Add”. The first one opens.
- The checklist follows the area's name, such as Roof or Bathroom. Tap “Change list” if another fits better.
- Tap “Defects” to open the full list. Search it, or tap an element to jump to it, and tick each defect you find. Give each one a severity, from “Minor” to “Urgent”, and a note if it helps: where it is and how much.
- Switch to “Checks” at the top and tick each check you carry out. Tap “Done” to go back.
- Something not on the list? Tap “Not on the list?” at the bottom, or search for it and tap “Add”. Type it, or use the mic or “Smart Build”.
- Tap “Mark area complete” (or “Complete: no defects found”). If you could not get to it, tap “Couldn't inspect” and say why.
- Tap “Next” at the bottom, or the arrow at the top, to go to the next area or room. After the last one, it takes you on to the next section of the survey.
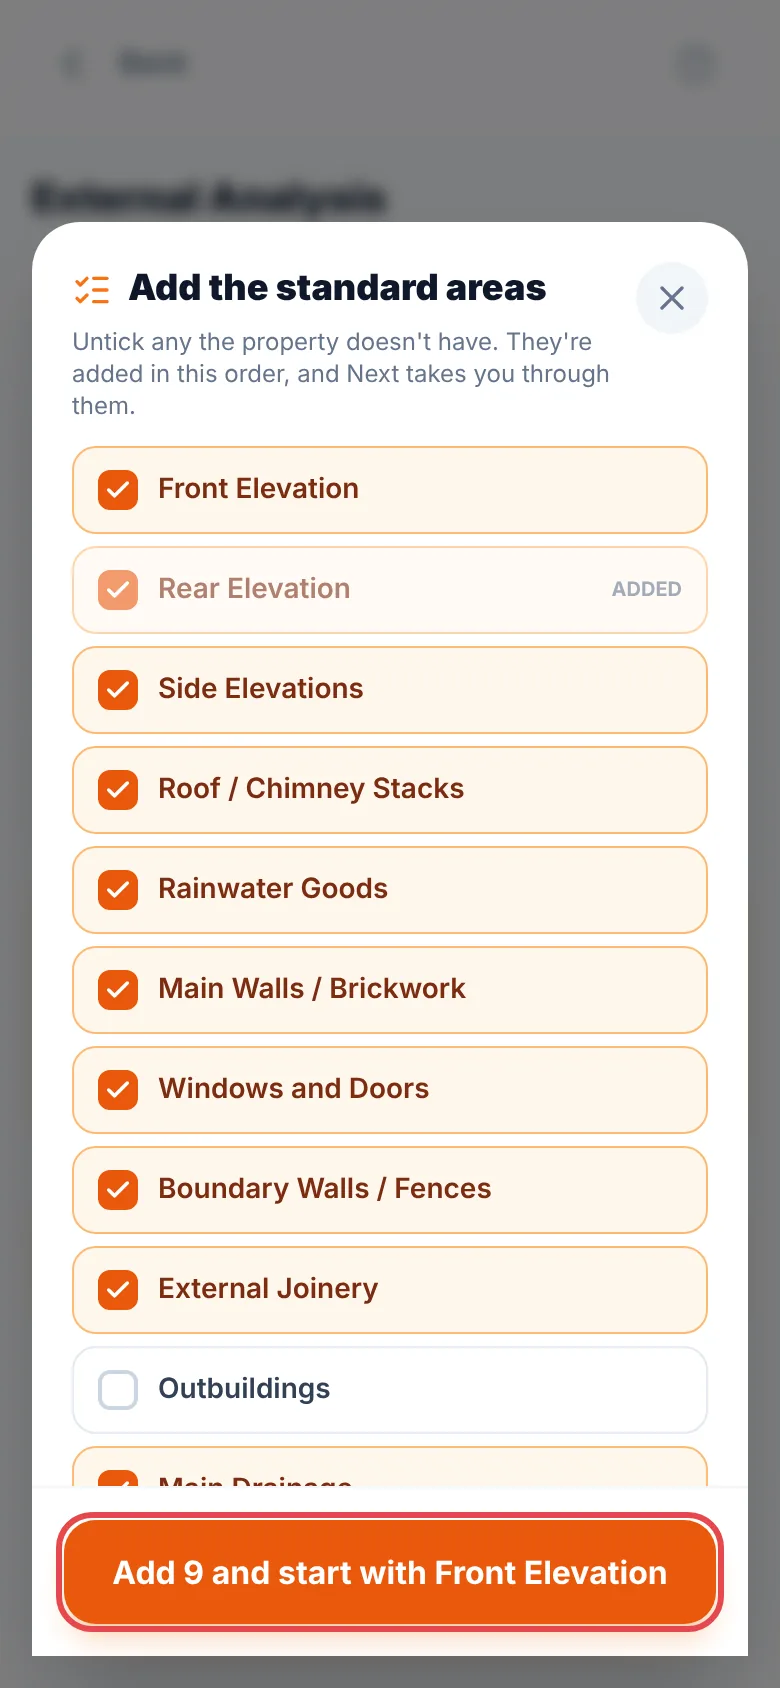
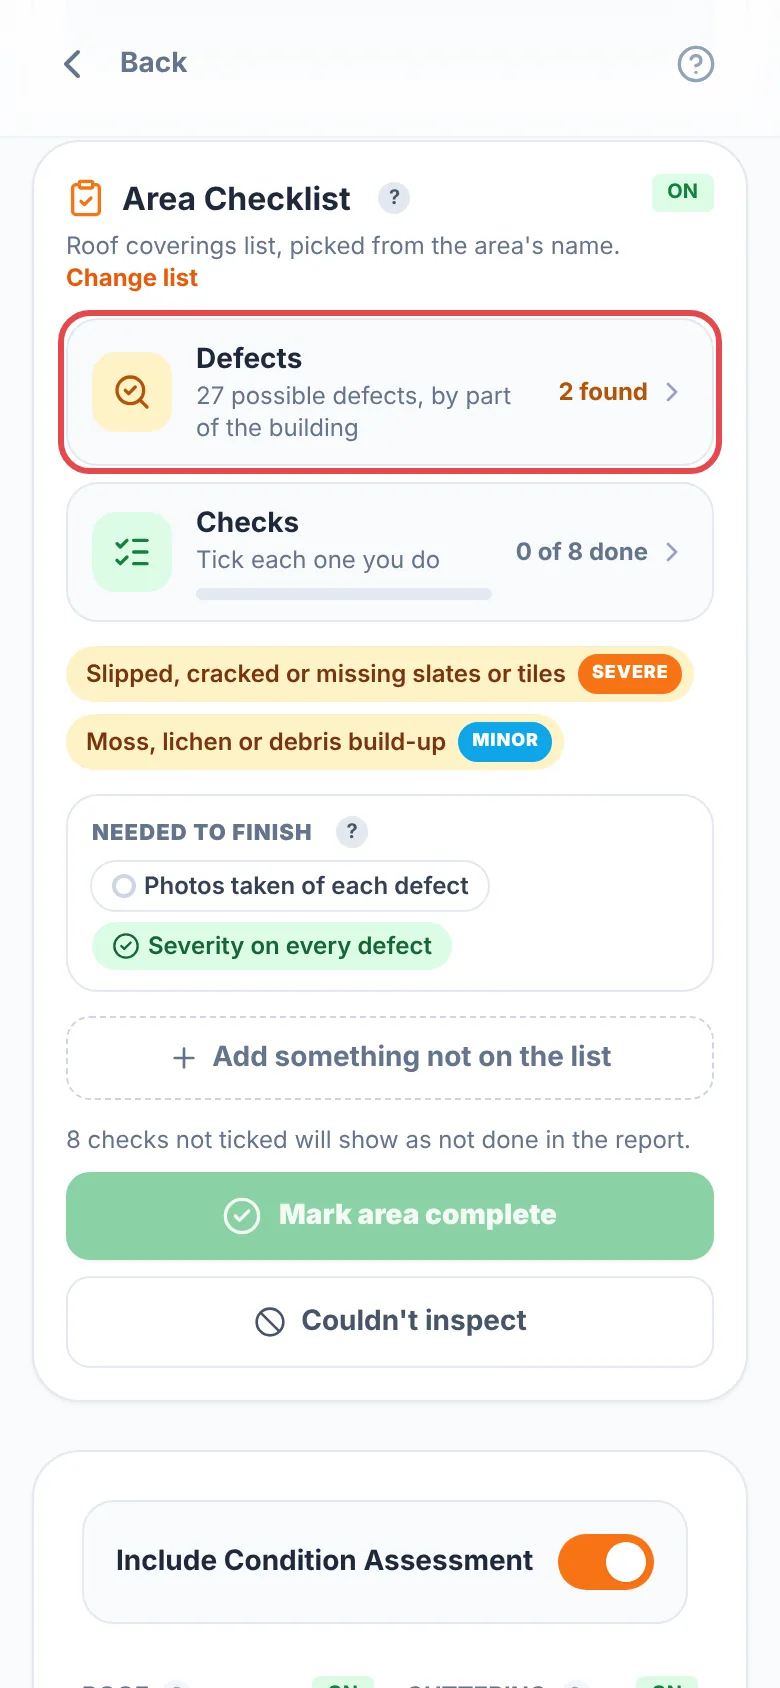
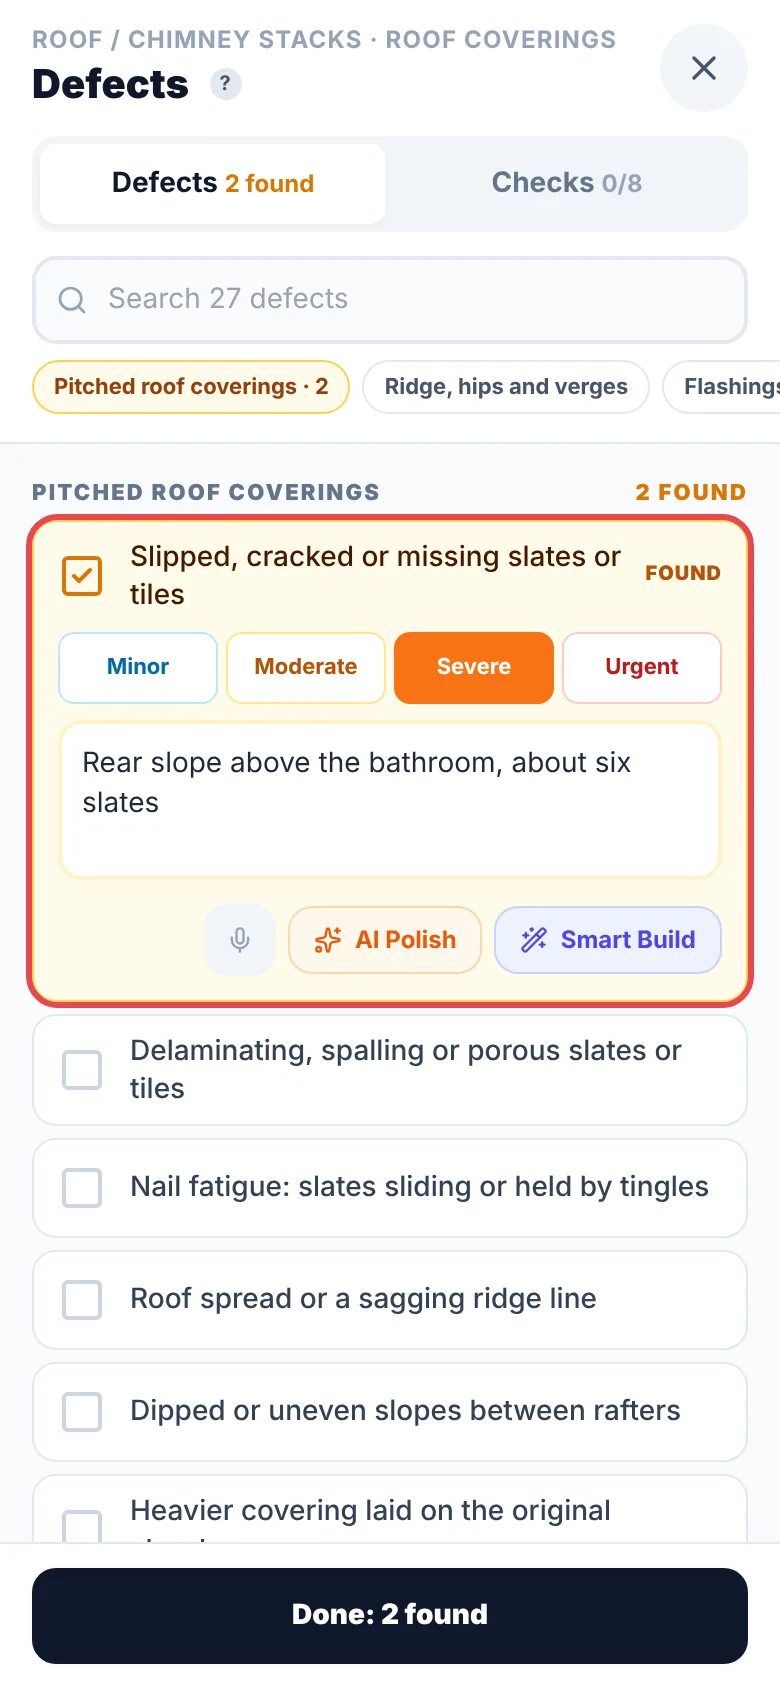
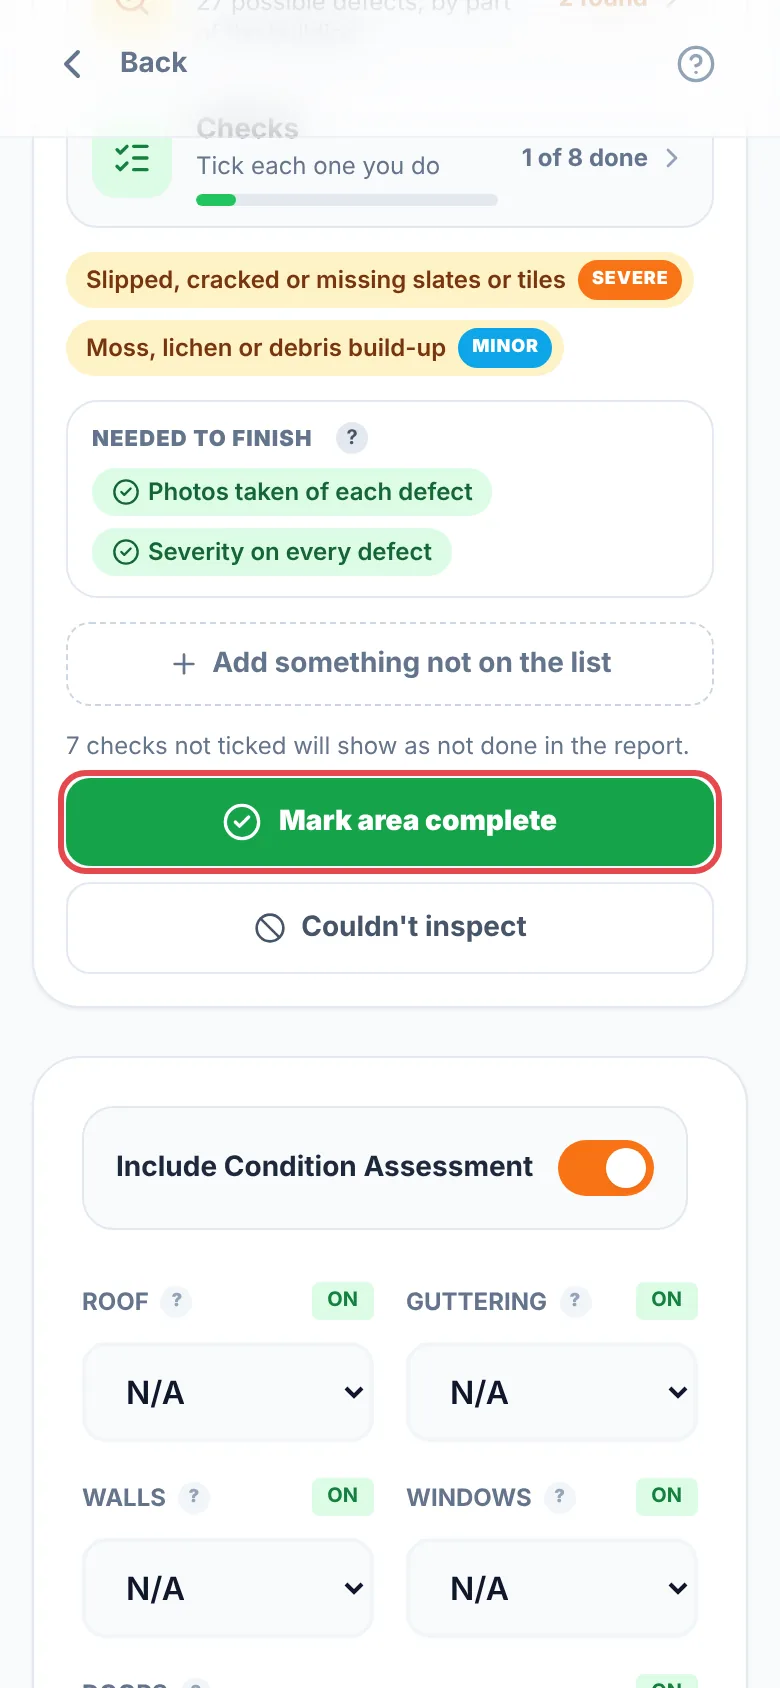
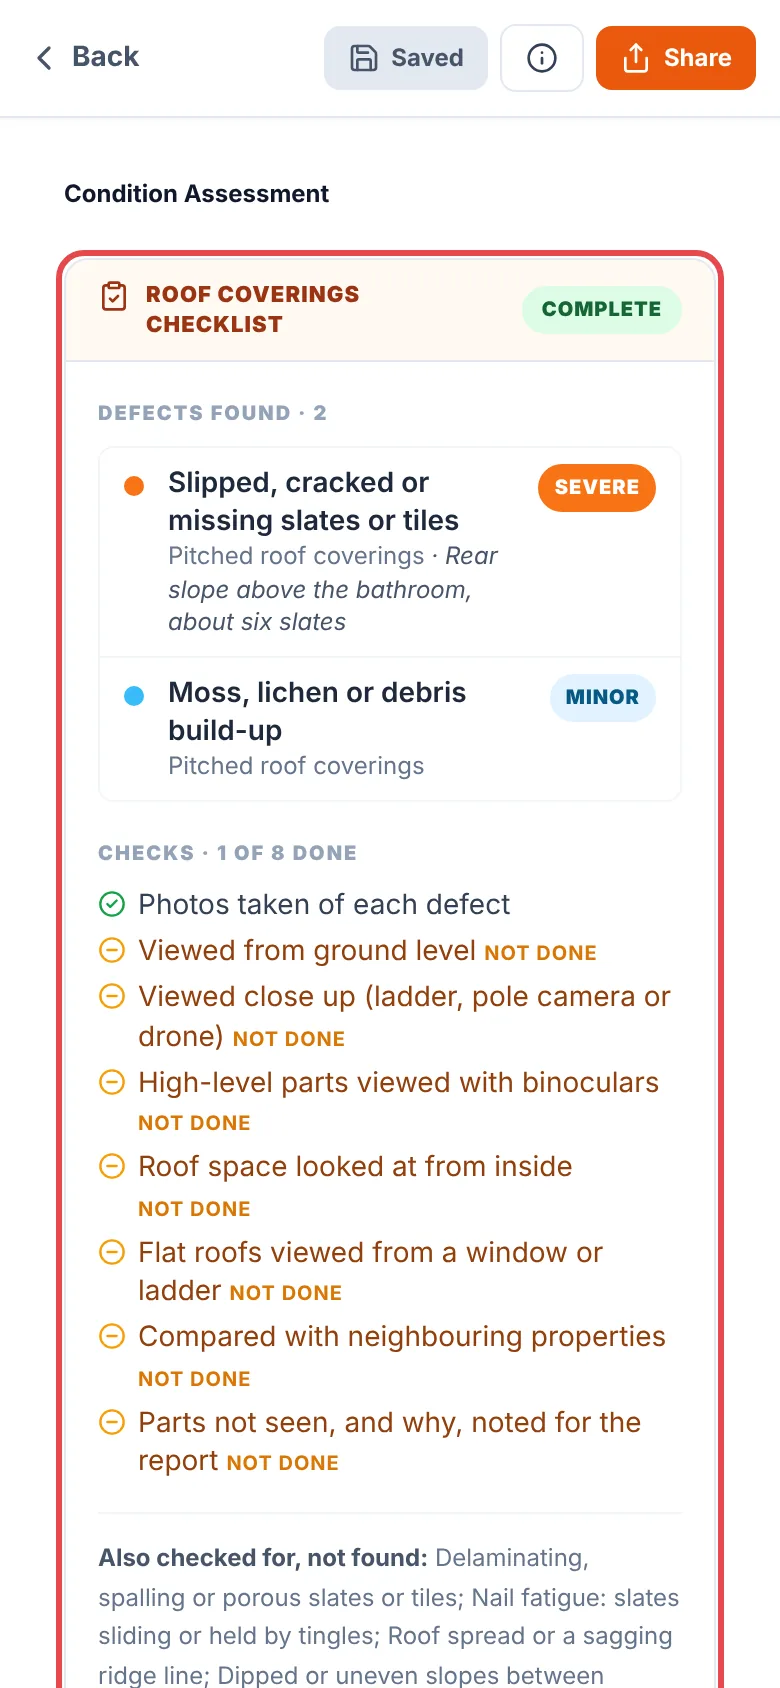
- In the report: each area shows the defects found, worst first, with their severity and note, and the checks done. Once it is complete, the report also lists what you checked for and did not find, and, where your Required Sections ask for area checklists, any checks not done. Checks nobody asked for are never listed as not done. Switch “ON” to “OFF” on the checklist to leave it out for that area.
- Schedule of Defects: every defect found on the survey is also listed in one table after the room findings, and can be saved as a spreadsheet. See Schedule of Defects.
- Your own items: Settings → Survey Tools → “Area checklists” adds defects and checks to any list, or to every outside area or every room. You can also tick “Add it to the … list for future surveys” when you add one on a survey. Your organisation can add them for you from the B2B portal.
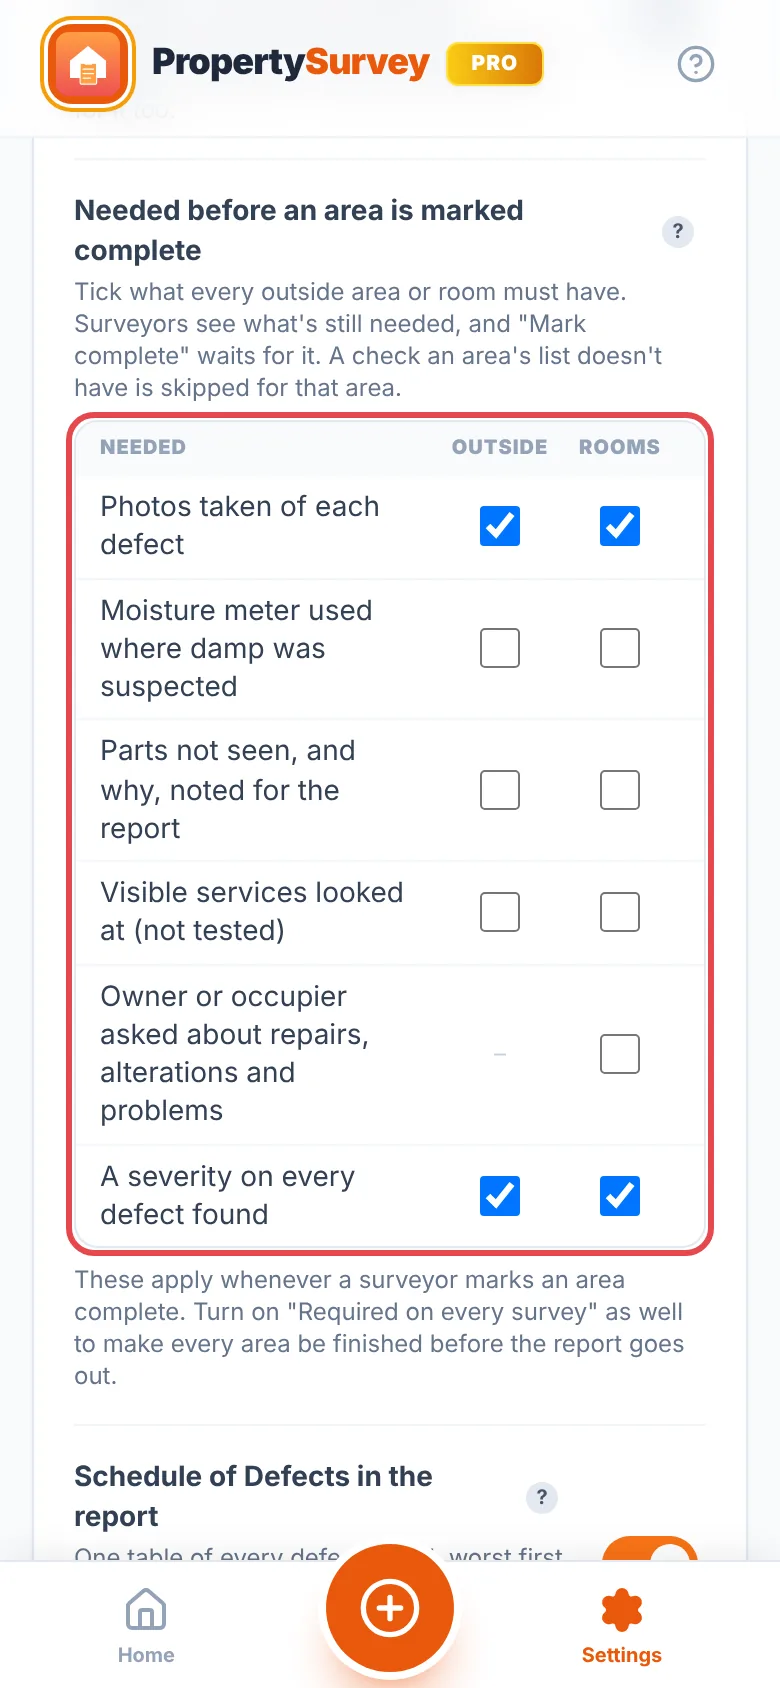
- Choose what's required: in the same place, turn on “Required on every survey” and choose which areas it covers. Under “Needed before an area is marked complete”, tick the checks every outside area or room must have, such as photos or the limitations noted, and whether every defect found needs a severity. The report can't be shared, emailed or printed until the areas are finished, and “Next” waits for each one. It is the same as ticking Area Checklists in Sections every report must have.
- New outside areas start with the atmospheric readings off. Turn on “Include Atmospheric Readings” if you want them in the report.
- Home Survey and Commercial reports keep their own element ratings; the checklists are part of the General Inspection.
- Follow-up visits start each area on the same list, with your own items kept and nothing ticked.
- Older surveys open and print exactly as they did. Turn Area Checklists off in Settings to hide them.
On a B2B team, your organisation can add items, make the checklists required and choose what each area needs for every device from the B2B portal.
Where to find it:Open a General InspectionReportSchedule of Defects
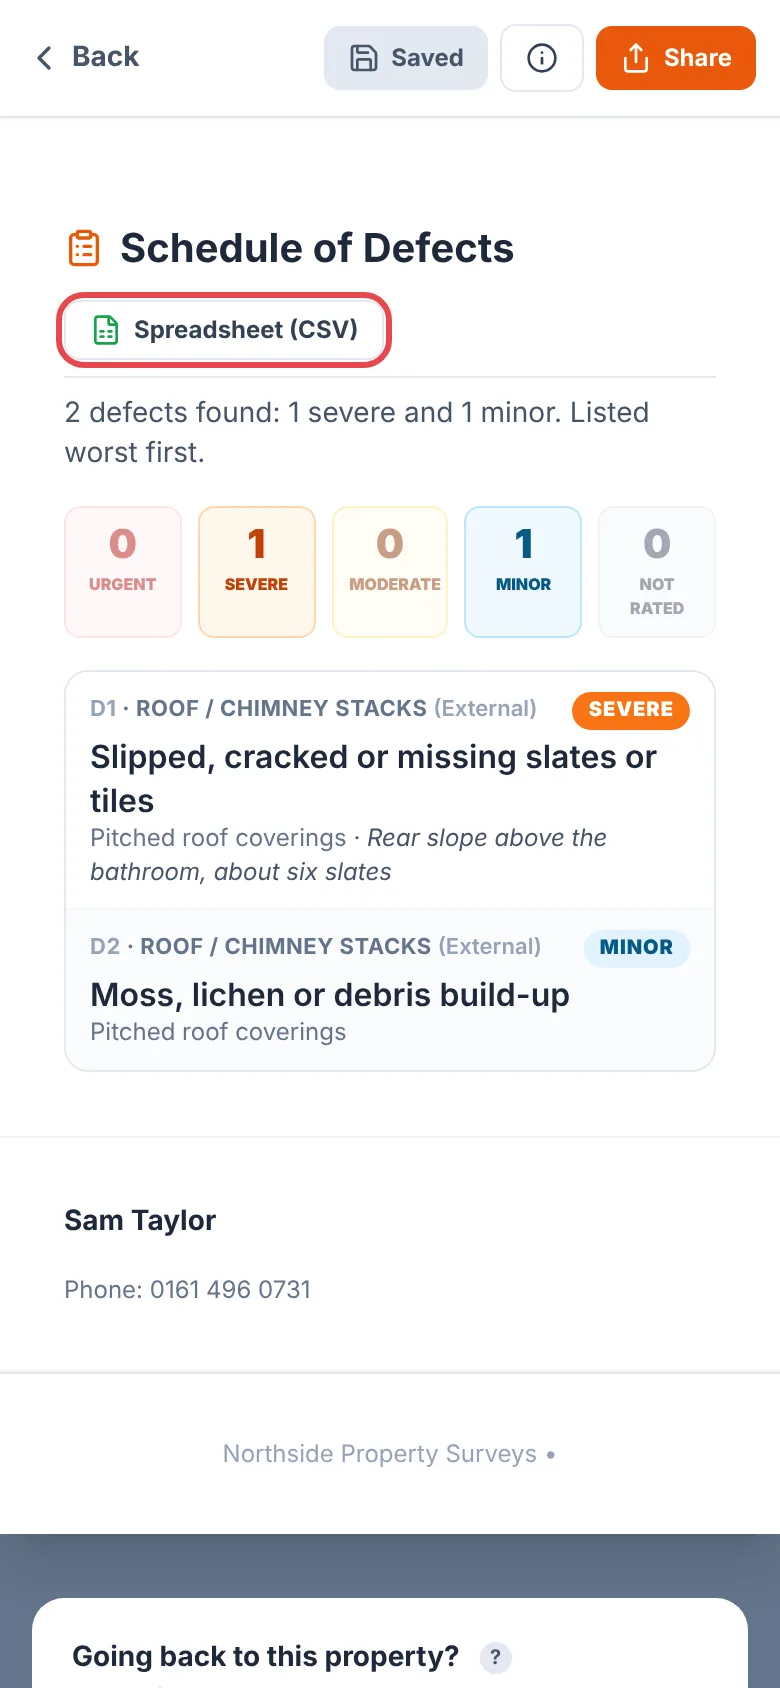
The Schedule of Defects lists every defect ticked on a General Inspection's area checklists in one table, worst first, so a client, landlord or contractor can see at a glance what needs doing and how soon. It is free.
- On each area checklist, give every defect you find a severity: “Minor”, “Moderate”, “Severe” or “Urgent”. Add a note to say where it is and how much.
- Open the report. The Schedule of Defects follows the room findings: a count for each severity, then a table of every defect with its reference, location, element, note and severity.
- To work with it in Excel, Numbers or Google Sheets, tap “More” at the top of the report screen, then “Schedule of Defects spreadsheet”, and save or share the file.
- What the severities mean: Minor is cosmetic or routine maintenance, put right in the normal course of repairs. Moderate needs repair to stop it getting worse. Severe is causing damage, or likely to soon, and should be repaired as a priority. Urgent is a risk to safety, or needs attention now. Tap a severity again to clear it.
- Under the table, the schedule lists the areas found clear, any not inspected with the reason, and any whose checklist is not finished.
- To leave it out of the report, turn off “Schedule of Defects in the report” in Settings → Survey Tools → “Area checklists”. The spreadsheet still works.
- To make severity required, tick “A severity on every defect found” under “Needed before an area is marked complete” in the same place.
See Area checklists for ticking defects off area by area.
Where to find it:Open a General InspectionOn-site ToolsAdd an assessment
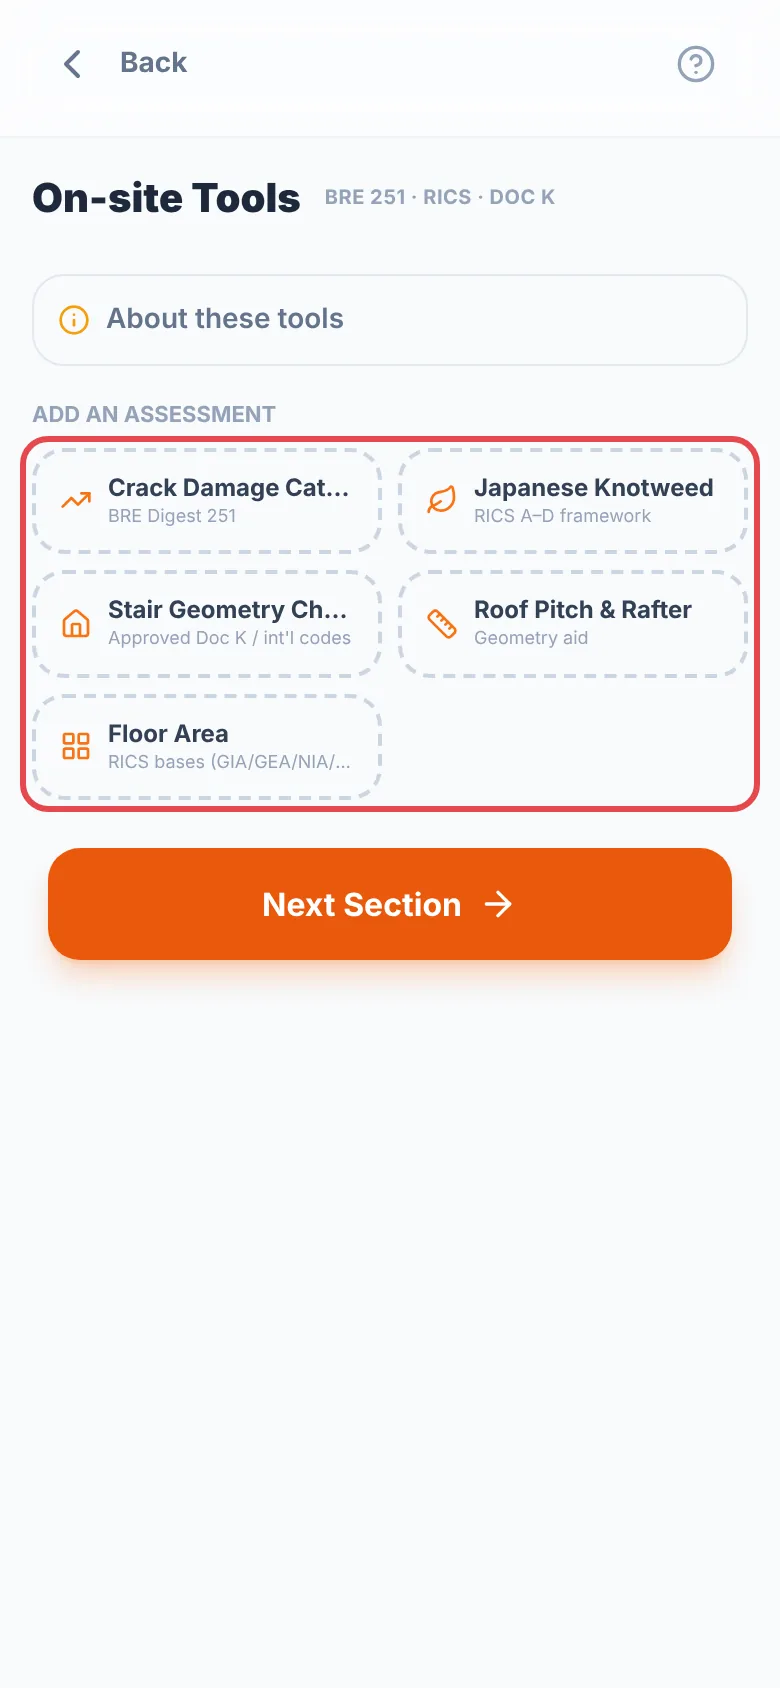
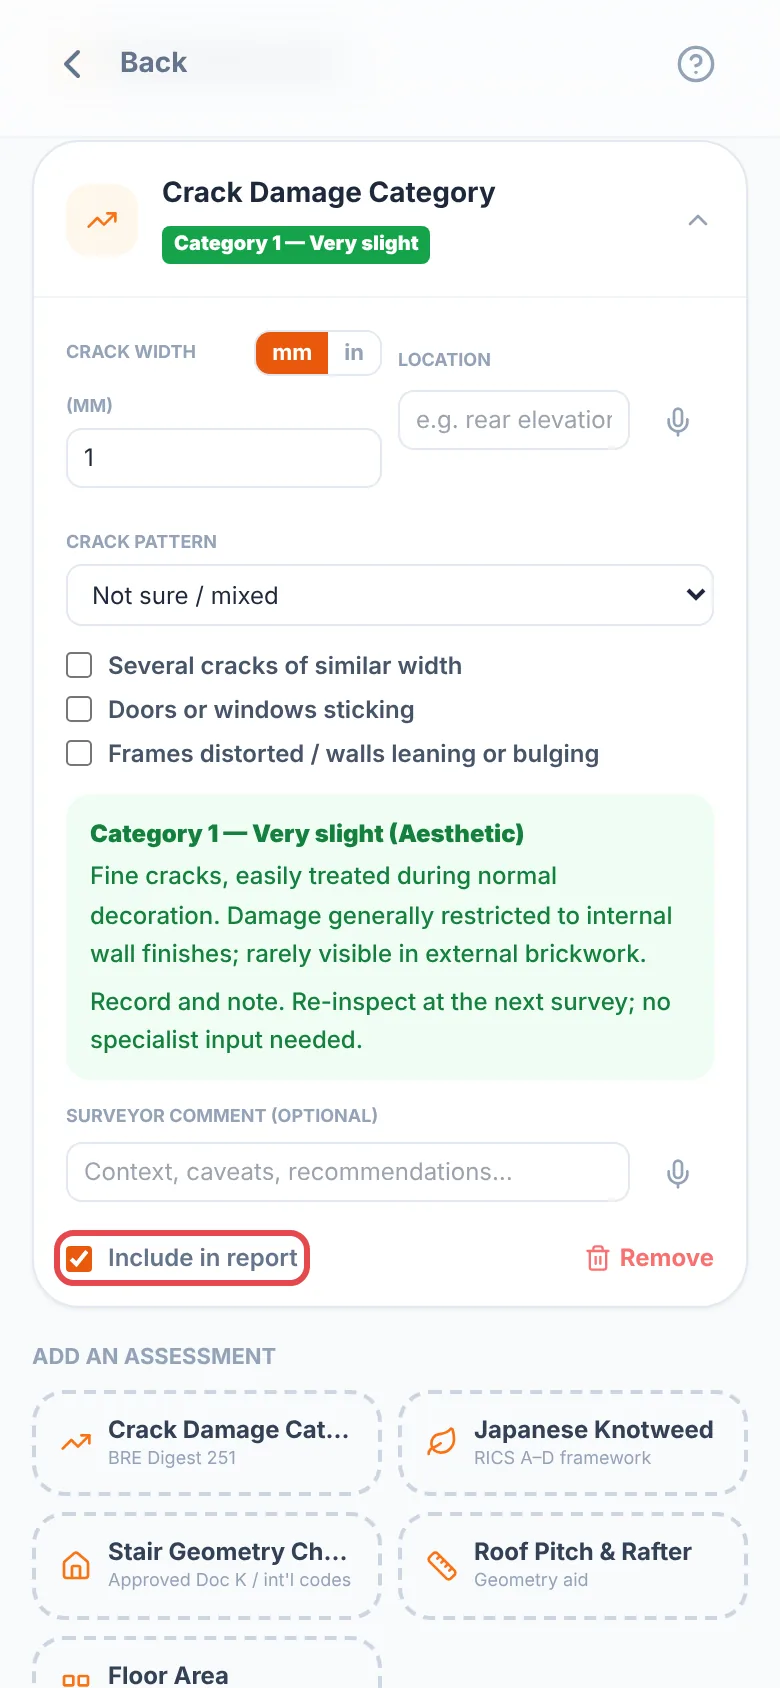
Five free calculators that work offline. Tick “Include in report” and each result appears in the report with your comment. In a Home Survey or Commercial survey, open them from “Property information” under “Optional Report Enhancements”, and they print as On-site Assessments after the inspection schedule.
- Crack Damage Category (BRE Digest 251): enter the crack width and any signs such as sticking doors, and get the category (0 to 5) with the recommended action.
- Japanese Knotweed: three questions give the A to D category used by lenders, with next steps.
- Stair Geometry Check: measure the rise and going to check them against Approved Document K or one of ten other national codes.
- Roof Pitch & Rafter: the pitch, rafter length and true roof area from a few measurements.
- Floor Area: add up rooms on a GIA, GEA, NIA or IPMS basis, in m² and sq ft.
Screening aids
These support your judgement; they do not replace it. Rules change between editions and countries, so check the current version before relying on a pass or fail, and refer structural or invasive-plant findings to a specialist.
Where to find it:Open a General InspectionFloor Plan(Home and Commercial: “Optional Report Enhancements”, then “Floor plan & AR scan”)
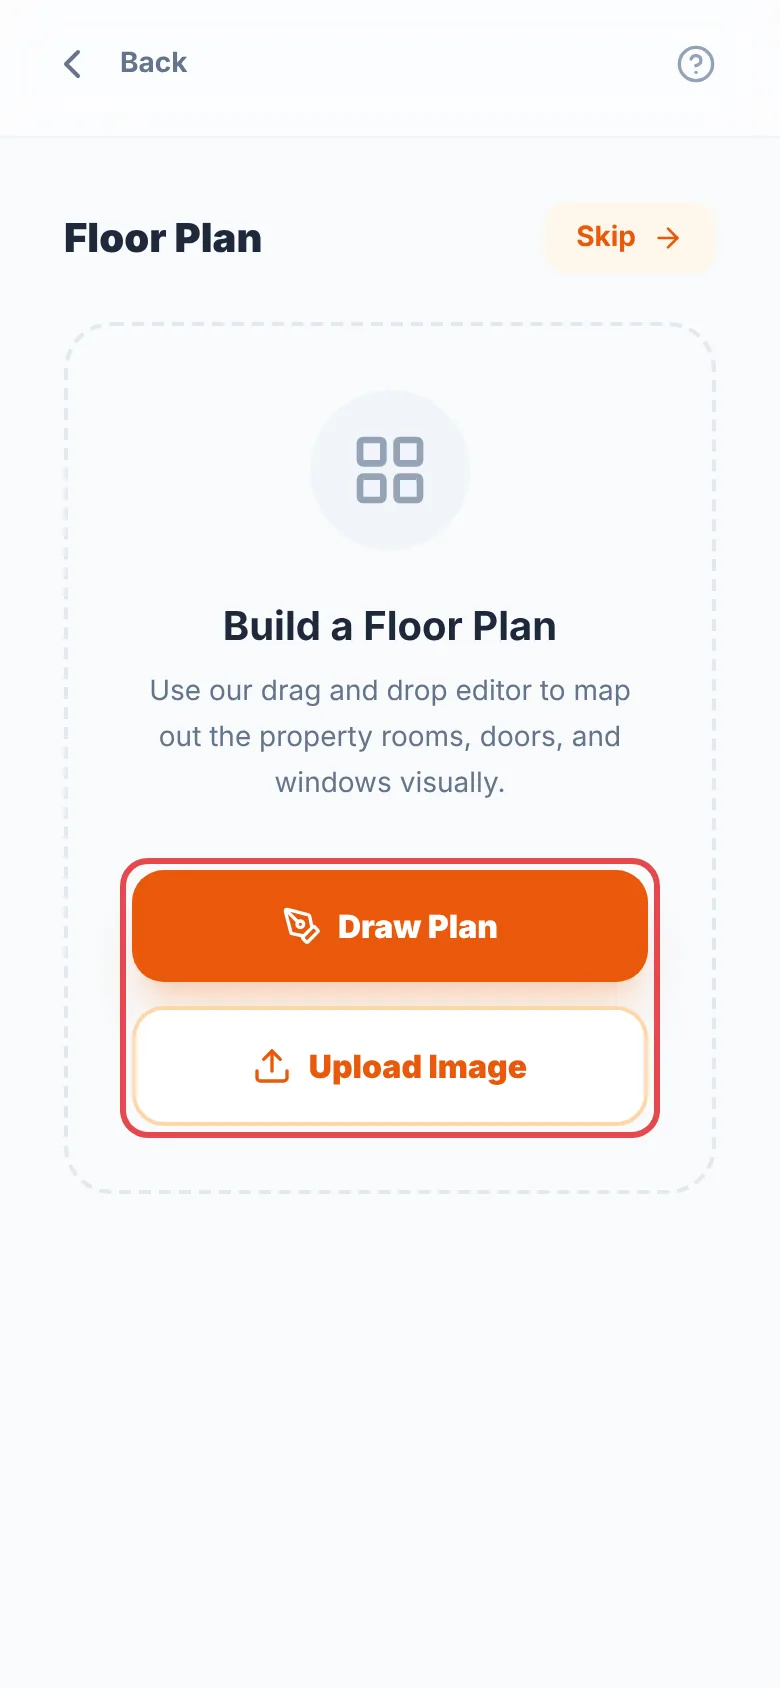
Choose “Draw Plan” to draw it yourself, “Upload Image” to use an existing plan, or “Scan a room with AR” PRO to scan it.
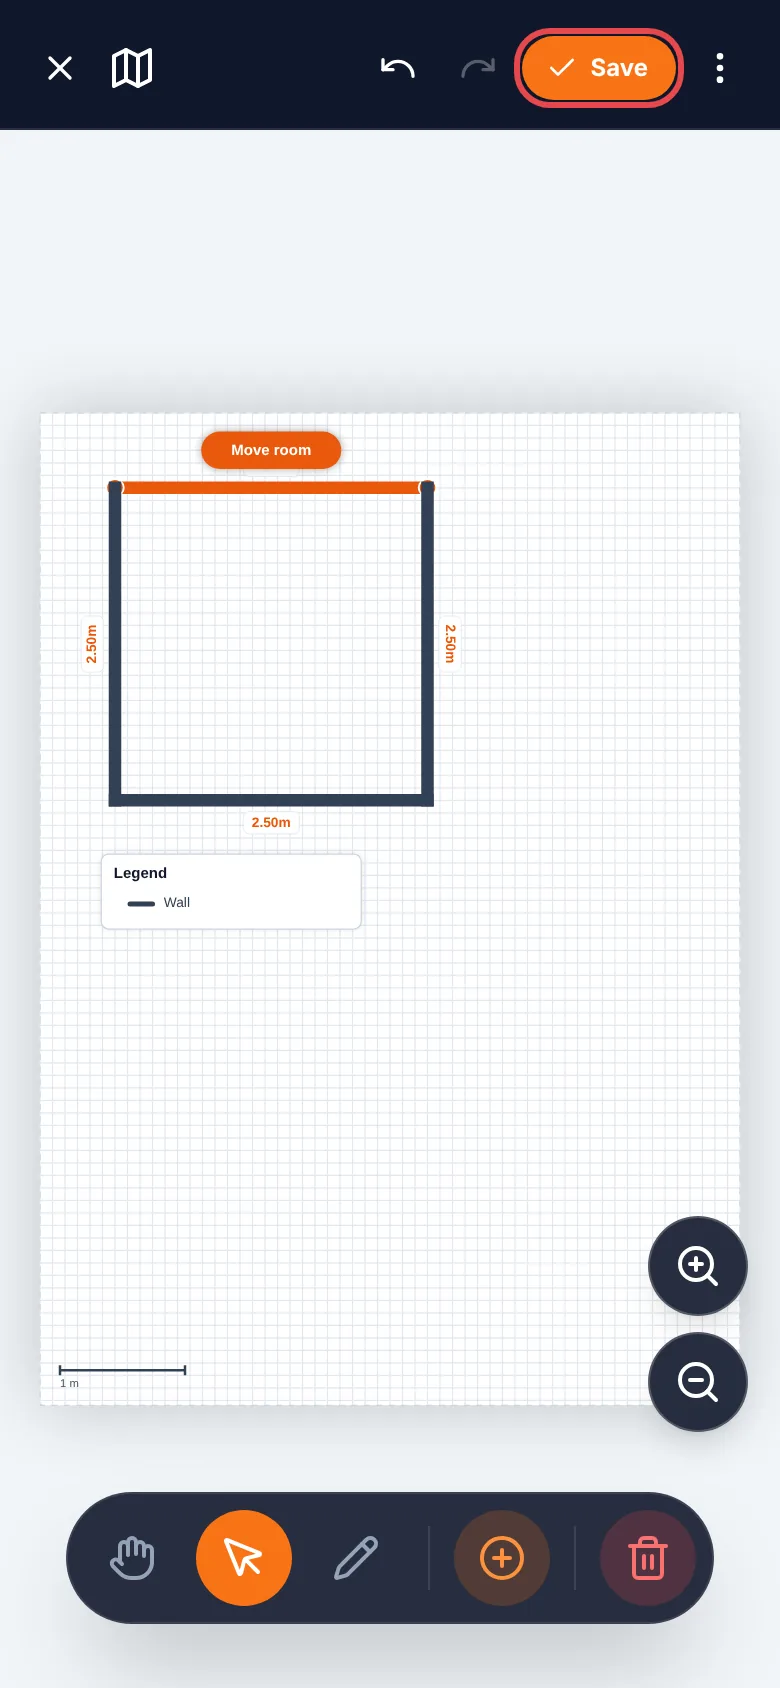
Drawing:
- Draw walls; they snap to each other and to square angles.
- Trace a room to get its floor area in m² or ft².
- Place doors and windows on the walls.
- Set the scale by drawing along something you have measured, such as a door, and typing its length.
- Drop condition markers and photo pins to show where each problem is.
AR scanning PRO needs an iPhone or iPad with LiDAR (Pro models) on iOS 16 or later. In the editor tap “Scan a room”, name the room and walk around it slowly. Scan more rooms and each one appears beside the last; drag its “Move room” tab to slide it into place. On other devices the scan option does not appear, and you draw instead.
Tap “Save” (with the tick) to add the plan and its key to the report. The ⋮ menu has “Export as PDF” for the plan on its own, and “Units” to switch between metres and feet.
Check key measurements
Scans are a fast starting point, not a measured survey. Measure anything important by hand.
Where to find it:Open a General InspectionWeatherFetch Weather(Home and Commercial: “Optional Report Enhancements”, then “Weather & orientation”)
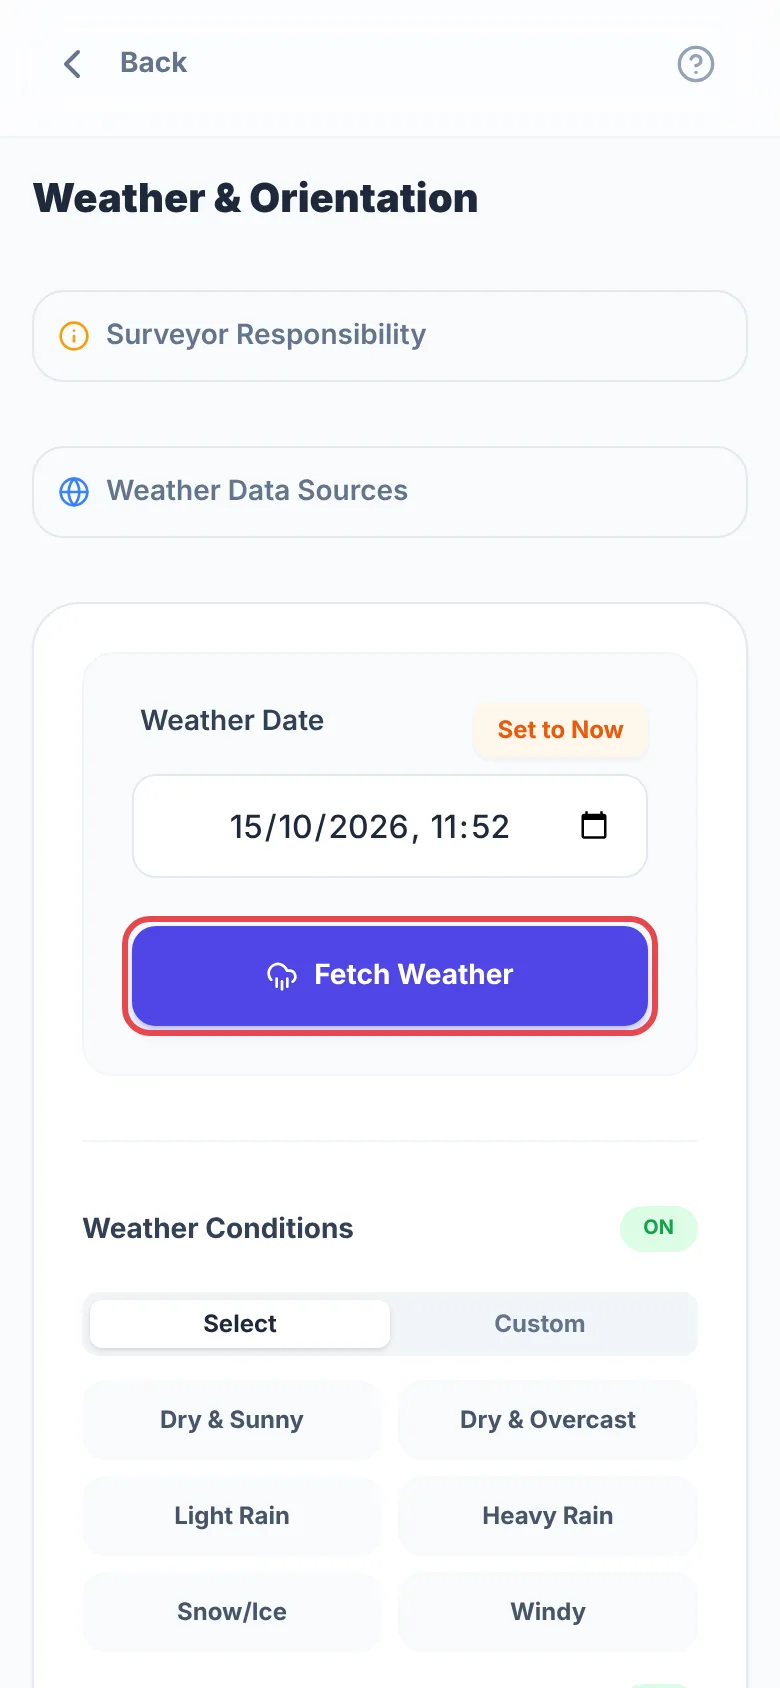
Weather affects how defects show, so the report records it. With Pro, tap “Fetch Weather” and the app fills in the temperature, humidity, wind and conditions at the property's address. If the survey date is in the past, it looks up the weather for that date instead. If the address is imprecise, tap “Pinpoint Property” to place it on the map, then “Confirm Location”.
- Daily limit: weather comes through our shared service, with a daily limit on each device. To remove it, add your own weather key.
- Rain radar: the small map shows rain from the last two hours. It can run about ten minutes behind, and shows nothing when it is dry, which is correct.
- Your own readings: you can type or correct every value.
Where to find it:Open a General InspectionSoil & Drainage(Home and Commercial: “Optional Report Enhancements”, then “Soil & drainage”)
Ground conditions matter for subsidence and foundation movement.
- Tap “Set Location” to put the pin on the property's address, or place the pin on the map yourself.
- Tap “Fetch Soil Data for Pin Location”.
- The app looks up clay, sand and silt levels, pH, organic carbon and nitrogen from ISRIC's global SoilGrids database, then works out the soil type and how well it drains. High clay content can mean shrink-swell risk.
- Choose a depth layer to see the ground below foundation level.
- The soil database can be slow, so give the lookup a little time.
- In built-up areas the app searches outwards for the nearest soil data. If none exists nearby, it says so.
Where to find it:Open a General InspectionPlanning & Constraints(Home and Commercial: “Optional Report Enhancements”, then “Planning & Constraints”)
Find out in one tap whether the property is listed, in a conservation area or in a flood zone, from the public registers for where it is.
- Fill in the property address first: in “Survey Details” for a General Inspection, or in “Instruction” for a Home or Commercial Survey.
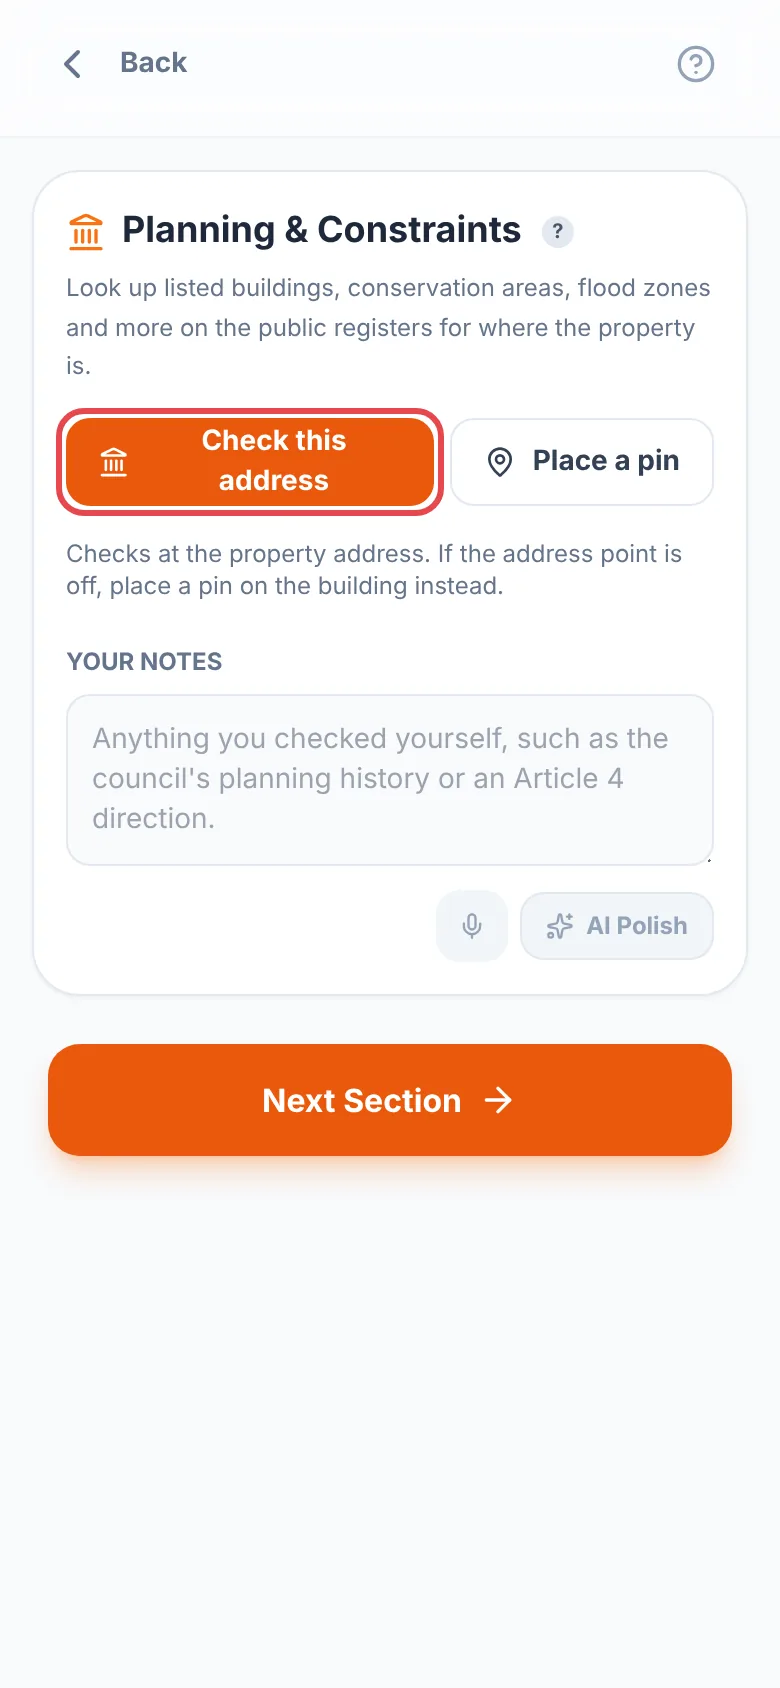
- Tap “Check this address”. Each result shows where it came from, with a link to the register entry.
- If the address lands in the wrong place, tap “Move the pin”, put the pin on the building and check again.
- Add anything else you know in “Your notes”, such as what the council told you.
- Where it works: England, Wales, Scotland, Northern Ireland and the United States. It follows your region in SettingsLanguage & Region, and is hidden where there is no public register to check.
- What it checks: listed buildings, conservation areas and flood zones in England, Wales and Scotland, plus scheduled monuments and World Heritage Sites. England also has tree preservation orders and Article 4 directions. Northern Ireland covers listed buildings and scheduled zones. In the US it checks the National Register of Historic Places and FEMA flood zones.
- Not covered by open data: the screen and the report say what to check yourself and where, for example Northern Ireland's flood maps, or a US city's own historic districts.
- Listed buildings are mostly recorded as a single point, so the check looks 30 metres around the address and says so.
- The report and PDF show each result, your notes, the date of the check and the registers used. On Home and Commercial Surveys they print with the other optional report enhancements. Untick “Include in report” to keep them out.
- Home Surveys: tap “Add to Pre-inspection research” under the results to add them to your pre-inspection research, one line per result, below anything you have already written. You can edit them there like the rest of your research. If you do, untick “Include in report” so they do not print twice.
This is not a legal search. Registers can be out of date or incomplete, so confirm anything important with the local planning authority.
Where to find it:Open a General InspectionEnergy Performance Certificate (EPC)(Home and Commercial: “Optional Report Enhancements”, then “Energy & EPC”)
- UK lookup PRO: tap “Fetch UK EPC Data”. The app uses the survey's address to find the property on the government register and fills in the ratings, floor area and expiry date.
- Other countries: choose your scheme under “Energy Reporting Scheme” (15 options, including Ireland BER, US HERS and Australia NABERS) and pick the ratings by tapping the scale. The report draws the right chart for that scheme.
- Recommendations: you can add energy-saving recommendations in their own box.
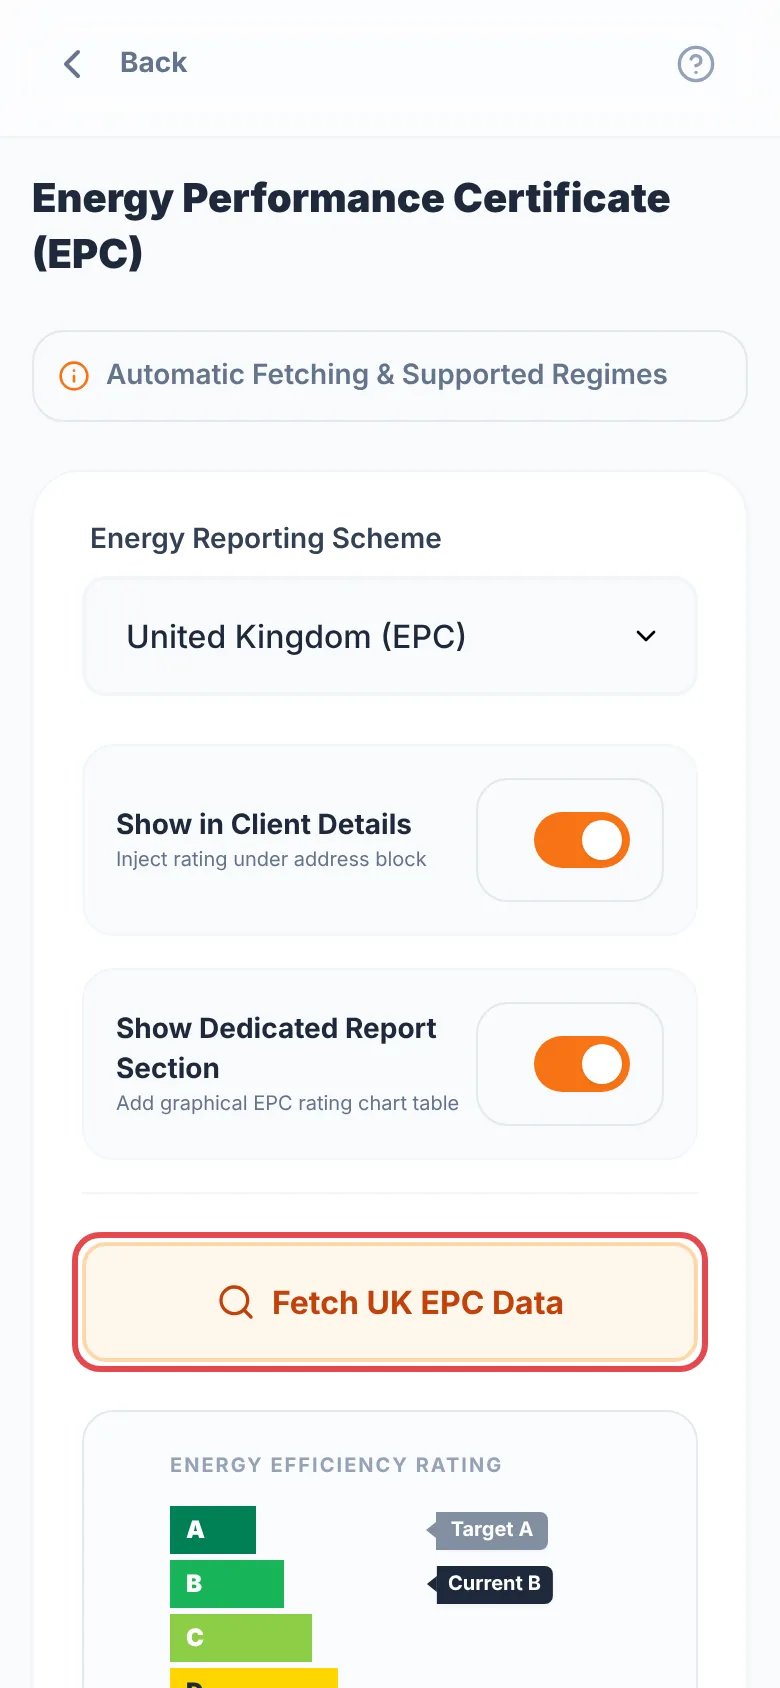
To leave EPC out of reports, turn it off in SettingsReportsVisible Narrative Sections PRO.
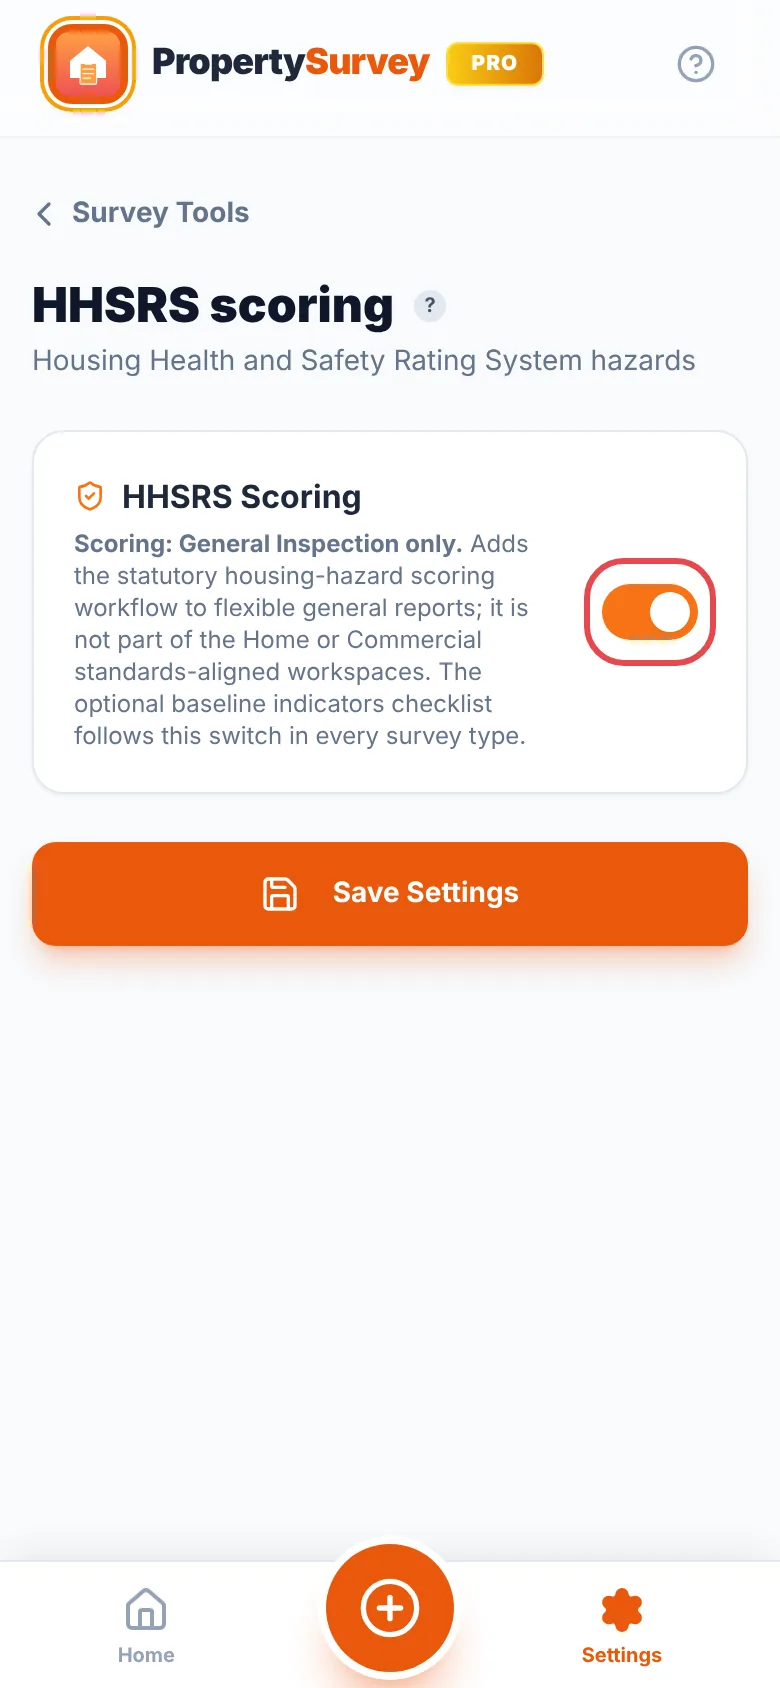
Where to find it:Open a General InspectionHHSRS Scoring(switch it on in SettingsSurvey ToolsHHSRS Scoring)
Scores housing hazards using the official HHSRS formula, as amended in 2026. It is part of General Inspections only.
- Add only the hazards you judge to be present. Quick buttons cover damp and mould, excess cold, fire and falls; “Other…” has all 21.
- Set the likelihood of harm over the next 12 months on the slider.
- Split the likely harm across the four outcome classes so they add up to 100%. The buttons help with this.
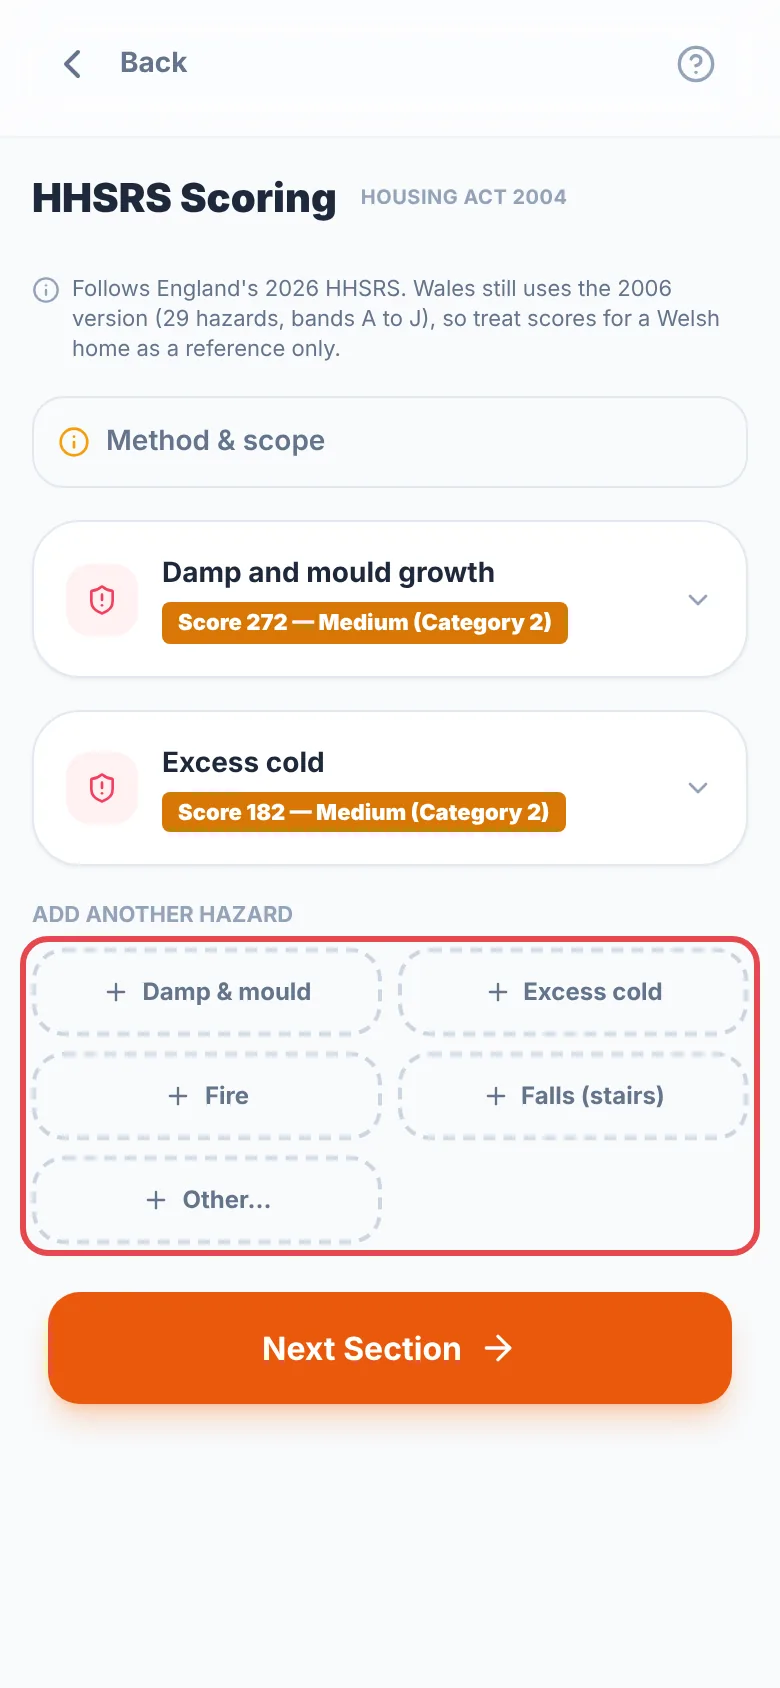
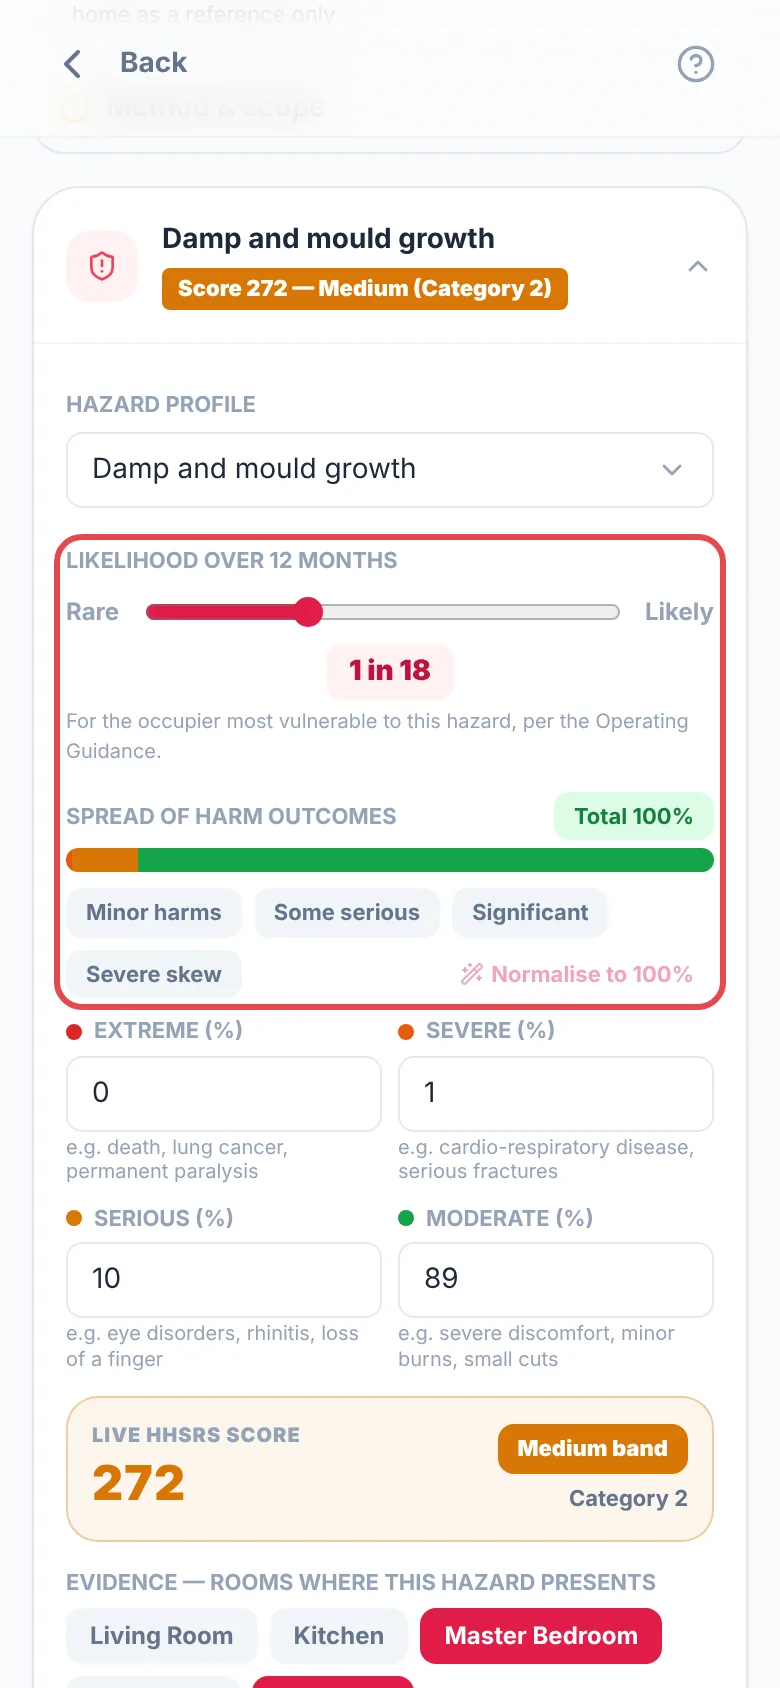
The slider and the outcome buttons use the 2026 scale points, and each hazard shows England's national average as a reference; tap “Start from this spread” to begin from its spread of harm. Wales still uses the 2006 version, and Scotland and Northern Ireland don't use HHSRS, so the app adds a note for a property there, placed by its planning check or else its postcode.
The score, band and category update as you go. A score of 1,000 or more is a Category 1 hazard. Link the rooms where you saw evidence, add notes, and the report shows each hazard clearly.
Your judgement, the official formula
The app never suggests a likelihood or harm split; it only does the sums. Enforcement decisions rest with the local authority.
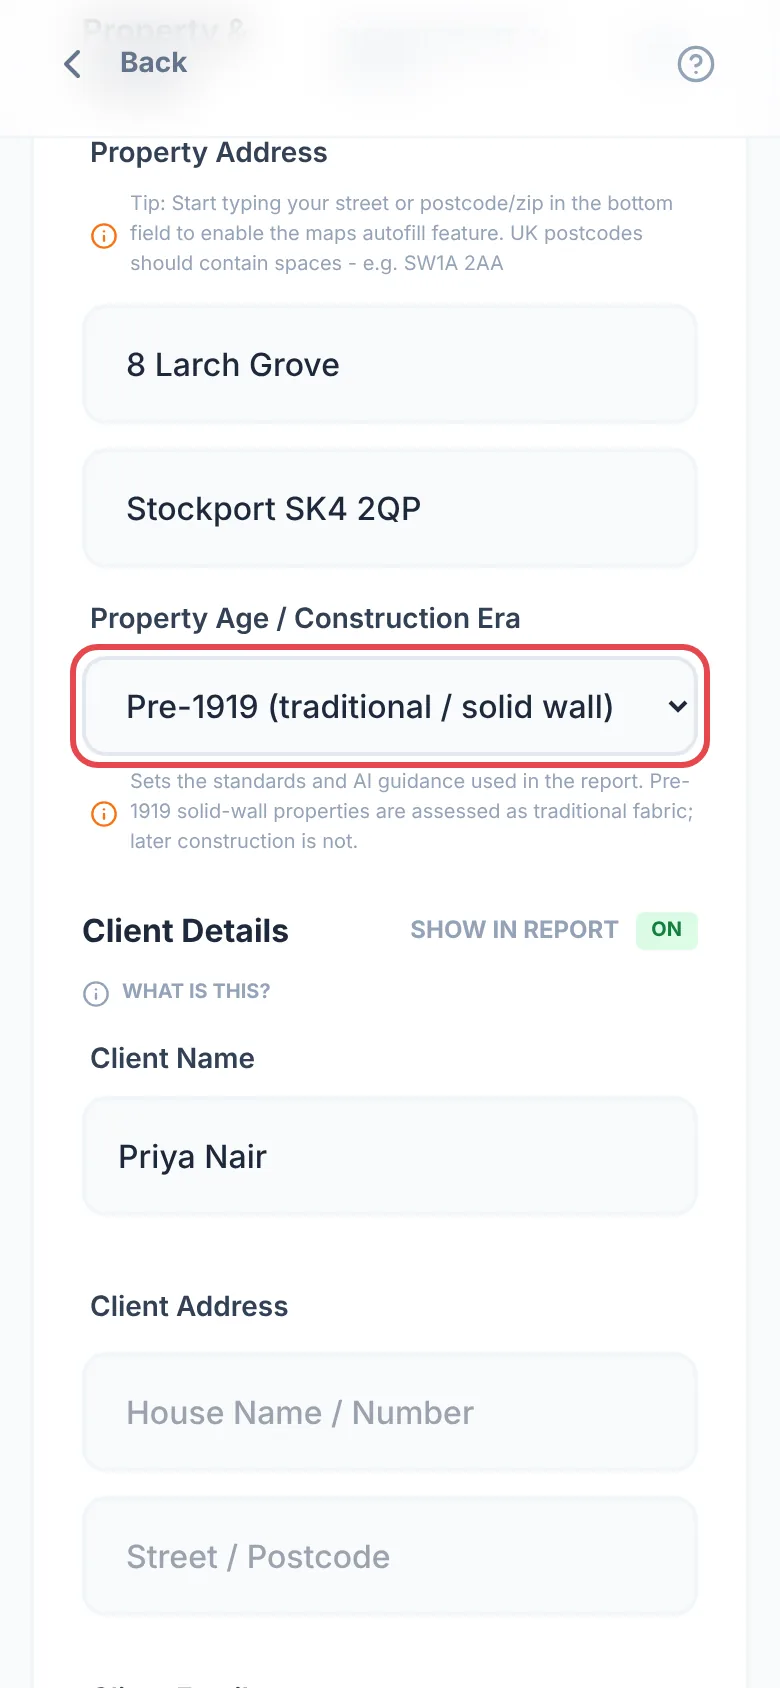
Where to find it:Open a General InspectionSurvey DetailsProperty Age / Construction Era
Choose “Pre-1919 (traditional / solid wall)” for older buildings. The AI then favours advice suited to breathable traditional materials such as lime and timber.
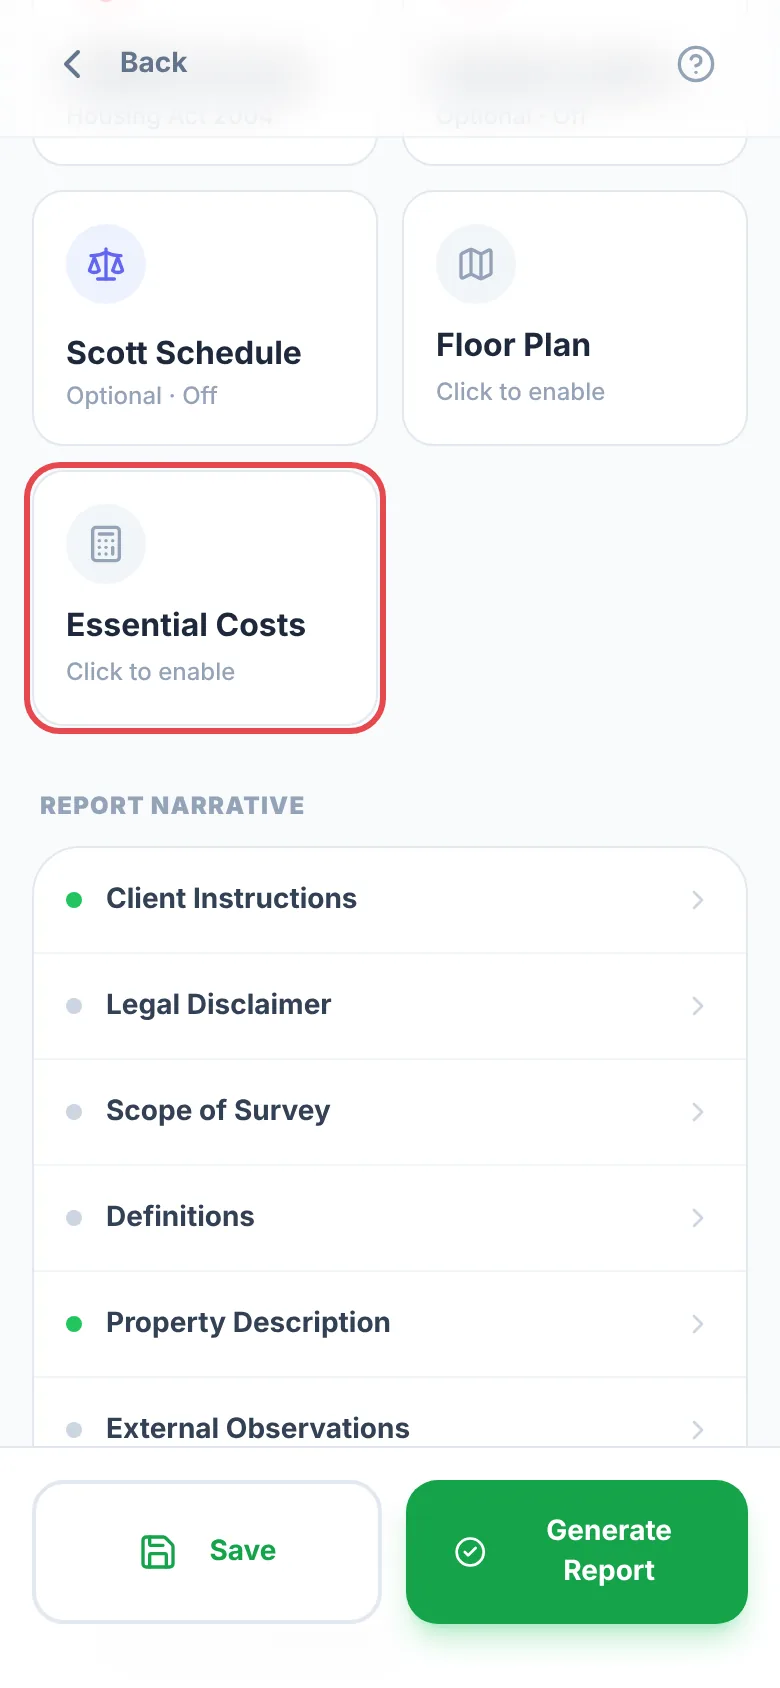
Where to find it:Open a General InspectionEssential Costs
- “Standard Items” adds common jobs from eight groups: external and structural, windows, doors and joinery, services and heating, dampness and insulation, internal and finishes, drainage and grounds, compliance and safety, and surveys and inspections. Search the list, tick what you need and change any price.
- “Add Custom Cost Item” adds anything else, with your own description and price. Long descriptions wrap in full in the report and the PDF.
- “Hide Amounts in Report” lists the items without prices. The eye beside an item hides just that price.
- Mark an item “Seek Further Advice” when it needs a specialist to price it. It is listed without a price and, like a hidden price, is not counted in the total.
- Switch on VAT to add it at your rate (20% unless you change it). The report shows the subtotal, the VAT and the total.
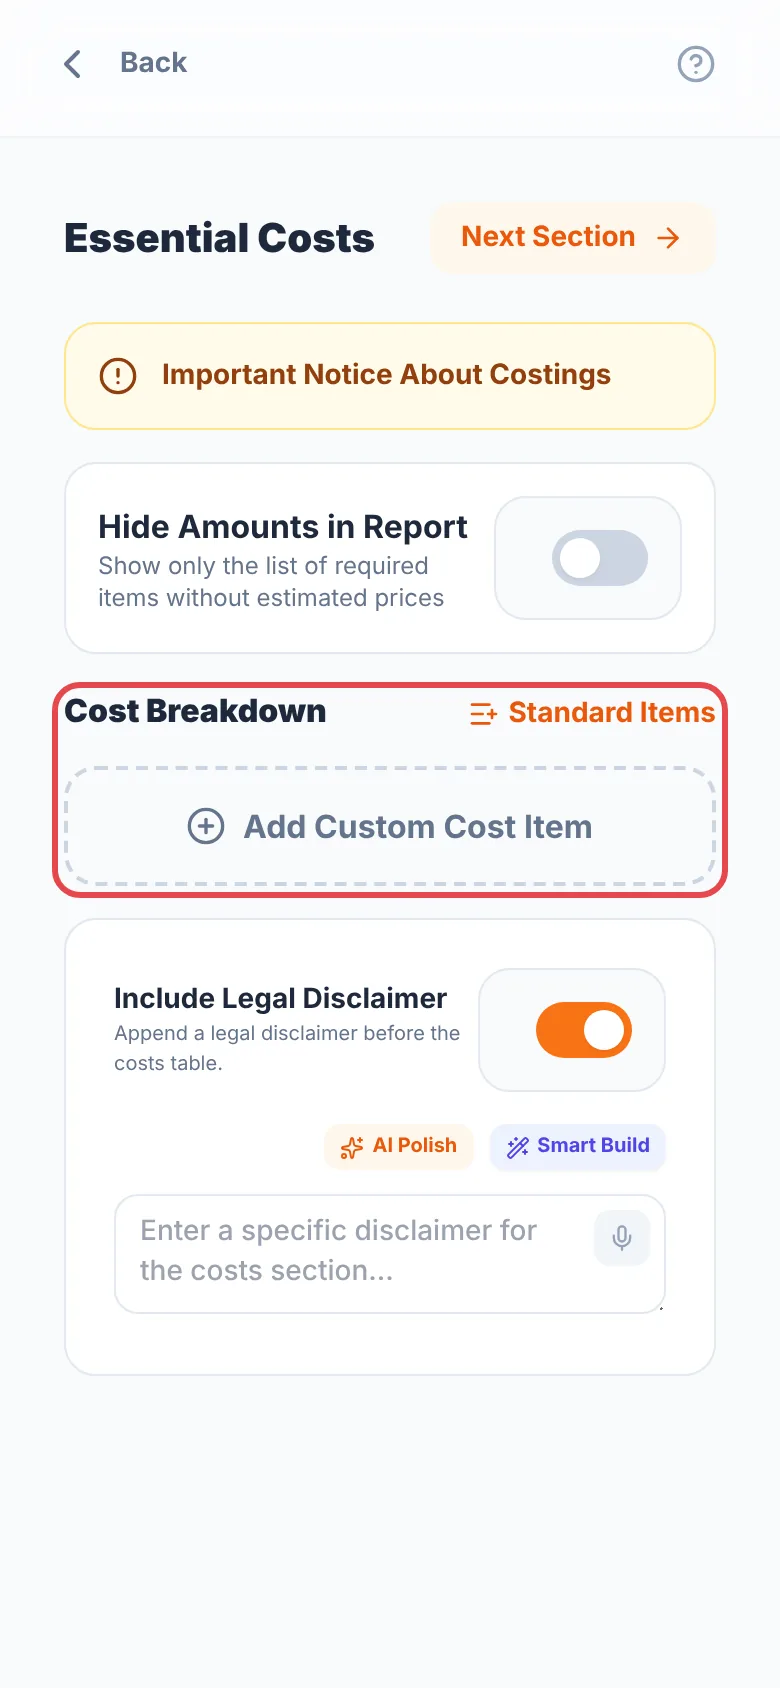
The report totals them in a table, in your region's currency. Your Independent Surveyor Disclosure prints with them when it is switched on. Switch it off for this survey, or reword it, at the bottom of the same screen.
Where to find it:Open a General InspectionScott Schedule(in a Home or Commercial survey: Optional Report EnhancementsScott schedule)
A Scott schedule answers a claim item by item: each side's case and costs side by side, with a column left for the reply, the agreed position or the decision. Use it to respond to a letter of claim, a schedule of dilapidations or a list of defects.
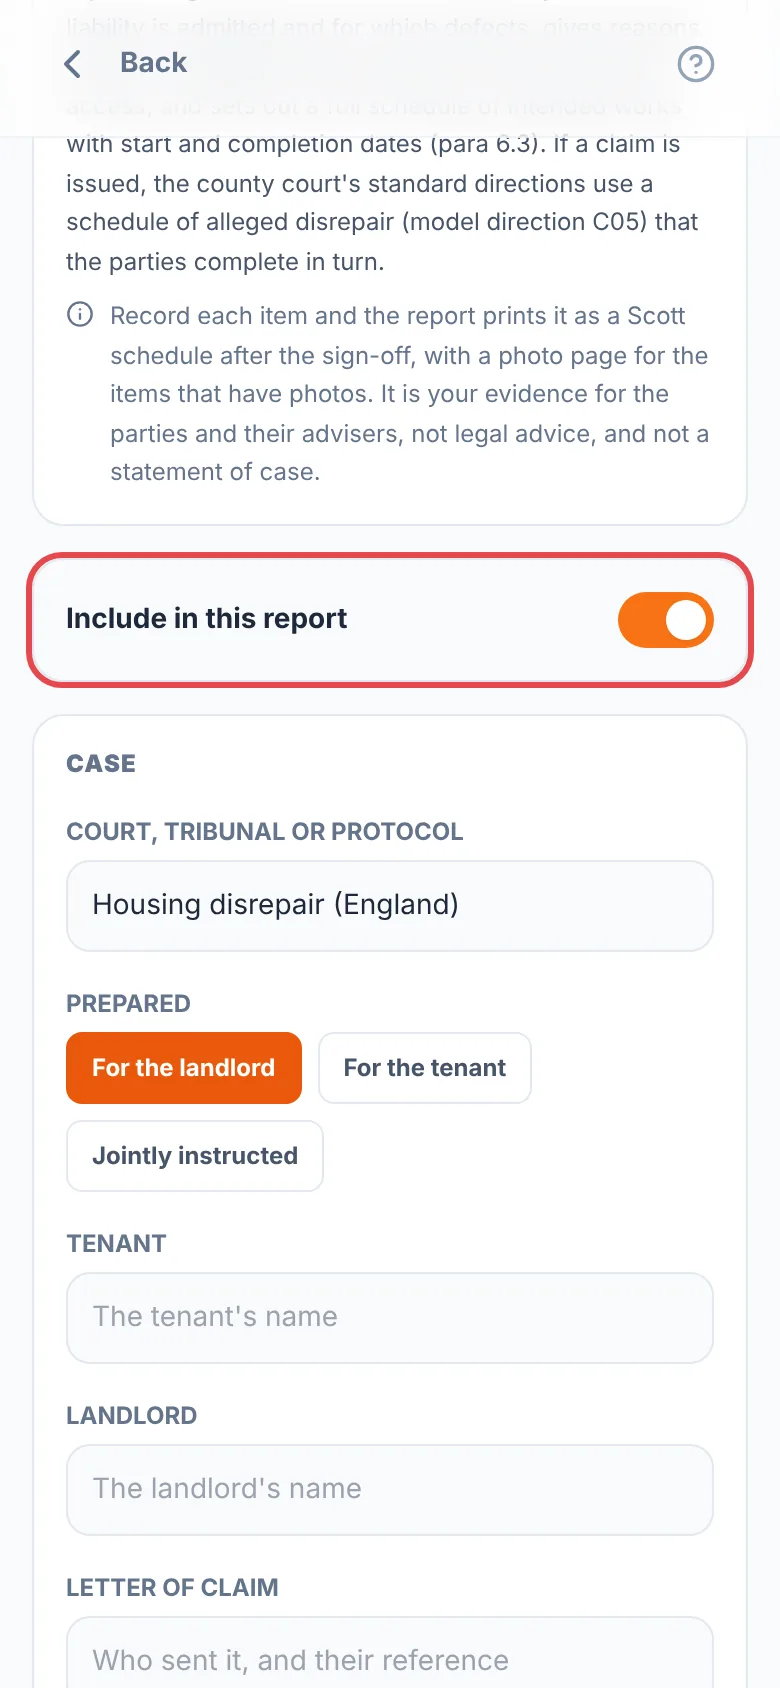
- Switch on “Include in this report”.
- Under “Court, tribunal or protocol”, pick the template. It sets the parties' names, the column headings and the response wording, and says where they come from. Templates for your region come first; the rest are under “Other jurisdictions”.
- Choose who you are preparing it for, then add the parties, the document you are answering and its date.
- Tap “Add item”, or “Add from survey findings” to start items from the rooms and outside areas you have recorded, with their notes and photos.
- For each item, record the claim, your findings, the response with quick reasons, the works and costs, and photos. Housing templates also take the date the defect was reported and the works dates.
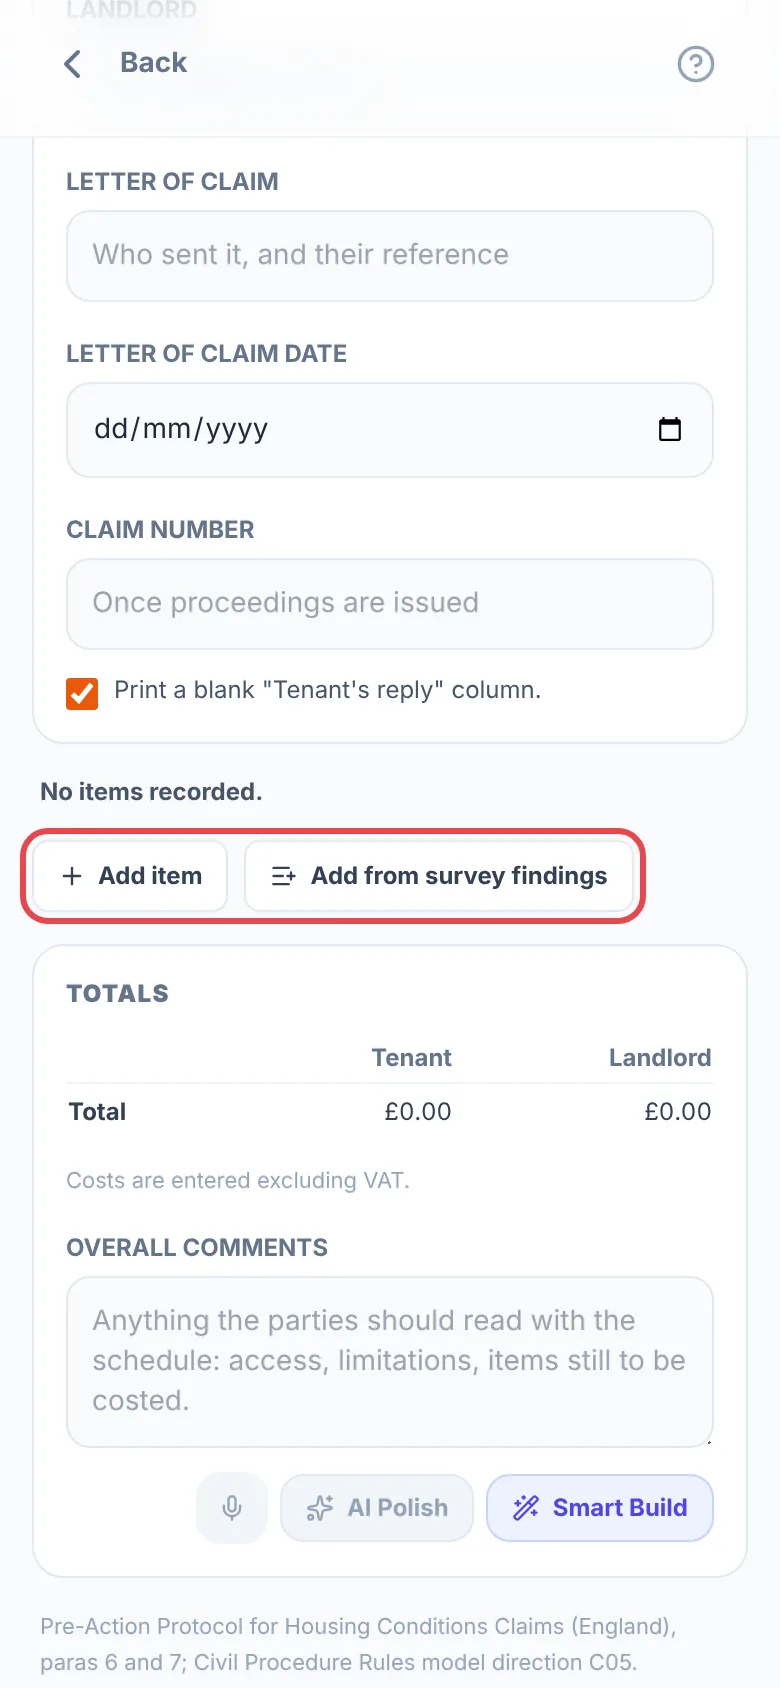
Each text box offers Smart Build wording for the template's kind of dispute, with its parties' names: the allegation, your findings, the response, each side's works and the overall comments.
The report prints the schedule after the sign-off, on landscape pages, with the totals (adding tax when the survey's costs do) and each item's photos. When you share, you can send it with the report, as a second PDF, or on its own.
To send it as a spreadsheet for the other side to answer, tap “More” at the top of the report screen, then “Scott schedule spreadsheet”. It has the template's column headings, the costs as numbers and the outcome column left blank, and opens in Excel, Numbers or Google Sheets.
If you never prepare Scott schedules, turn off “Scott Schedules” in Settings → Survey Tools → Scott schedules, and the schedule leaves your surveys. Schedules you already recorded are kept.
Your evidence, not legal advice
The schedule records your findings and each party's position for the parties and their advisers. It is not legal advice or a statement of case. Where a court or tribunal has given directions on the columns, follow them.
Where to find it:SettingsSurvey ToolsPhoto Timestamps
With Pro, the date and time are printed on your survey photos automatically, as a dated record of what you saw. It is on by default; switch it off with the toggle above.
“Photo Timestamp Source” chooses which time is used: when the photo was originally taken, or when you added it to the survey.
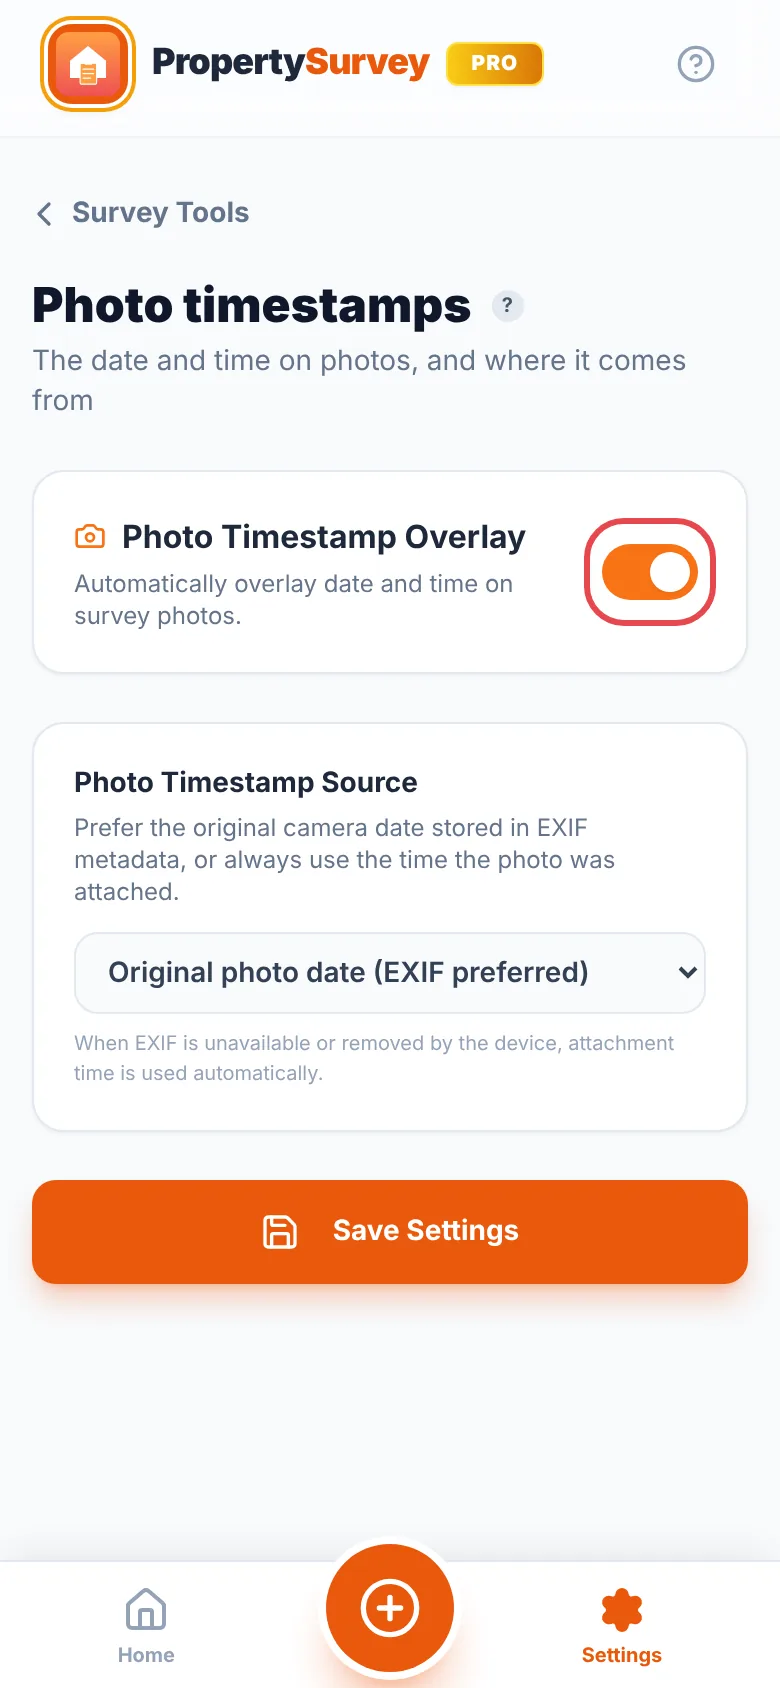
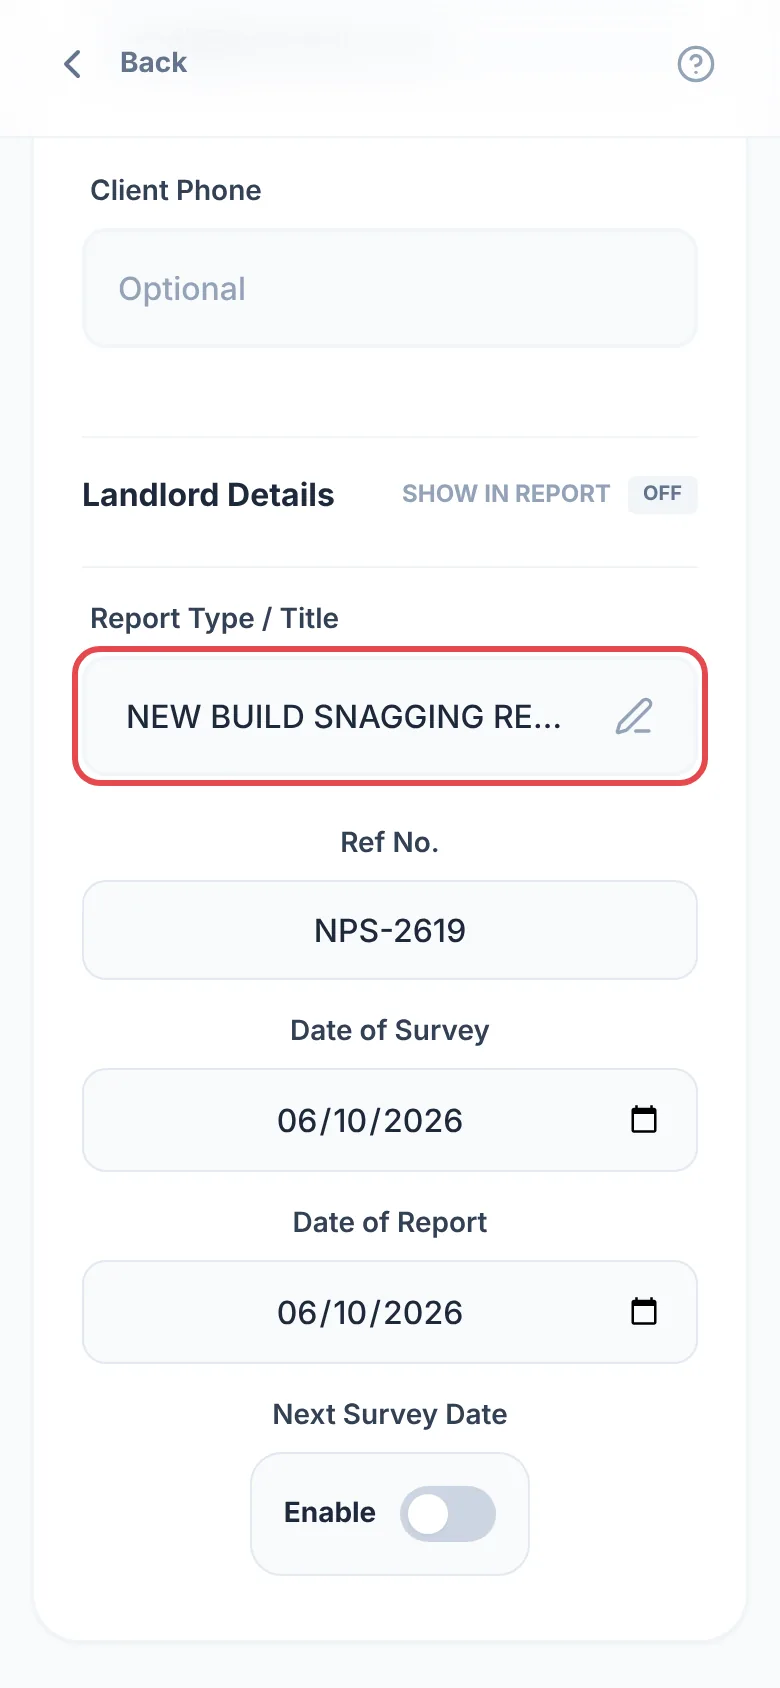
Where to find it:Open a General InspectionSurvey DetailsReport Type / Title
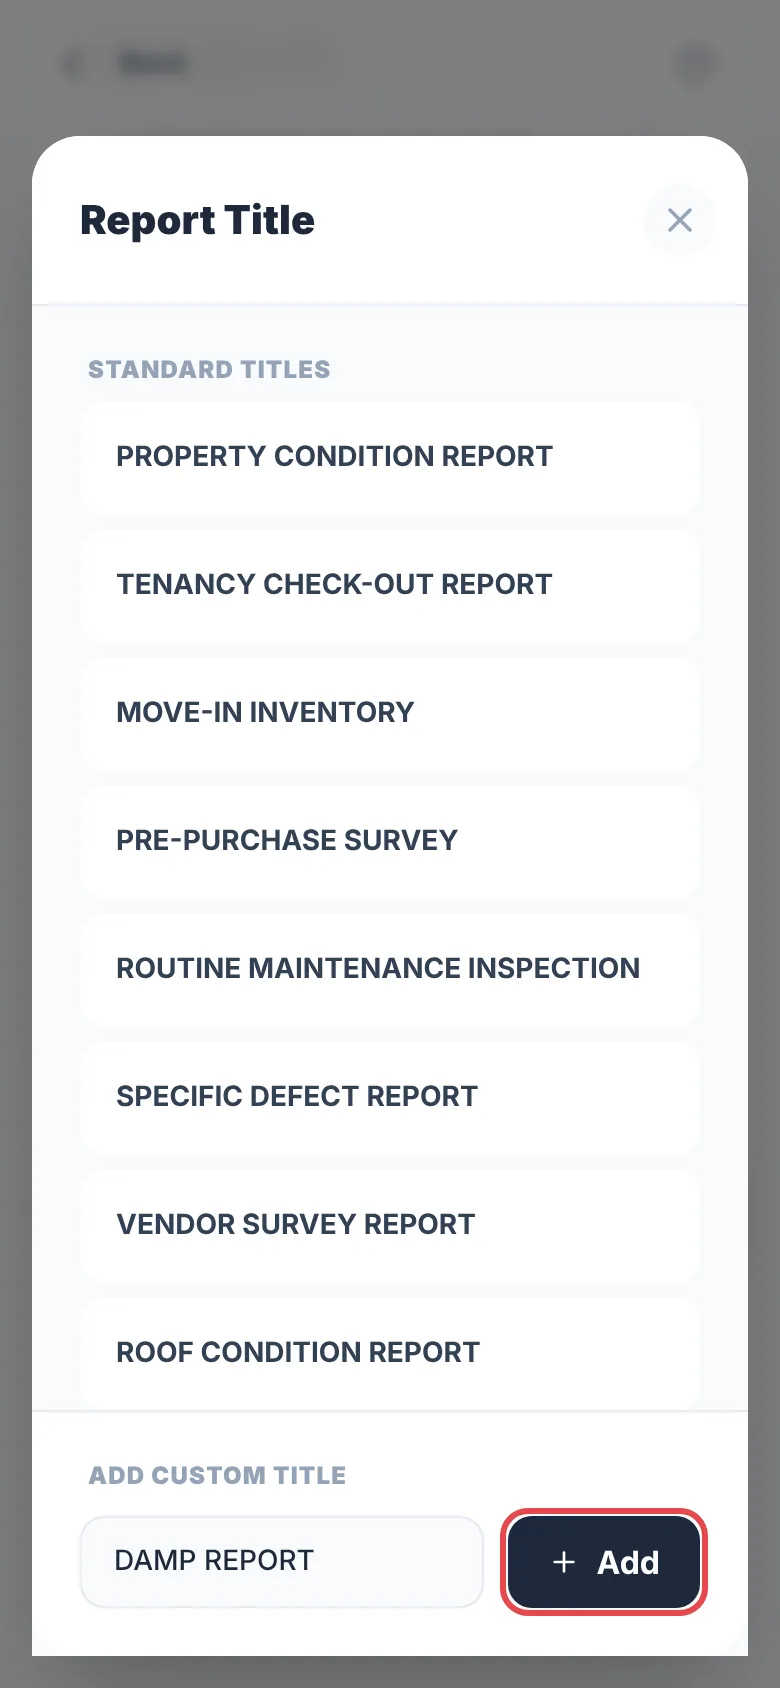
Pick a ready-made title, or tap “Add Custom Title” and type your own. The app remembers it for next time. To remove a saved title, tap the bin icon next to it in the same list.
AI & smart tools
Tools that write or tidy report wording for you. You always check the result.
- Free: 3 free uses of each AI tool every month (AI Polish, photo analysis, the summary, its translation and Talk through a room). Before you use one, the app shows how many are left and asks you to confirm with “Use 1 Free”. They reset on the 1st of each month, and are counted on each device.
- Pro: AI works every day through our built-in service, up to a daily limit.
- Pro with your own key: no limit from us. You pay Google or OpenAI directly, usually a few pence a day. See Set up your own AI key.
If you see “AI Limit Reached” or “Daily AI Limit Reached”, look it up in Troubleshooting.
AI Polish turns rough notes into professional wording. Type or dictate a note, then tap “AI Polish” (it has a sparkle icon) under or beside the box. It is on almost every text box, including photo captions and the report's editable text, where it shows once you tap into a box. It also works on your default report wording in Settings PRO.
You type: cracked brickwork above rear window, might need repointingAI Polish gives: Diagonal stepped cracking was noted to the masonry above the rear elevation window. Localised repointing is recommended to prevent further deterioration.
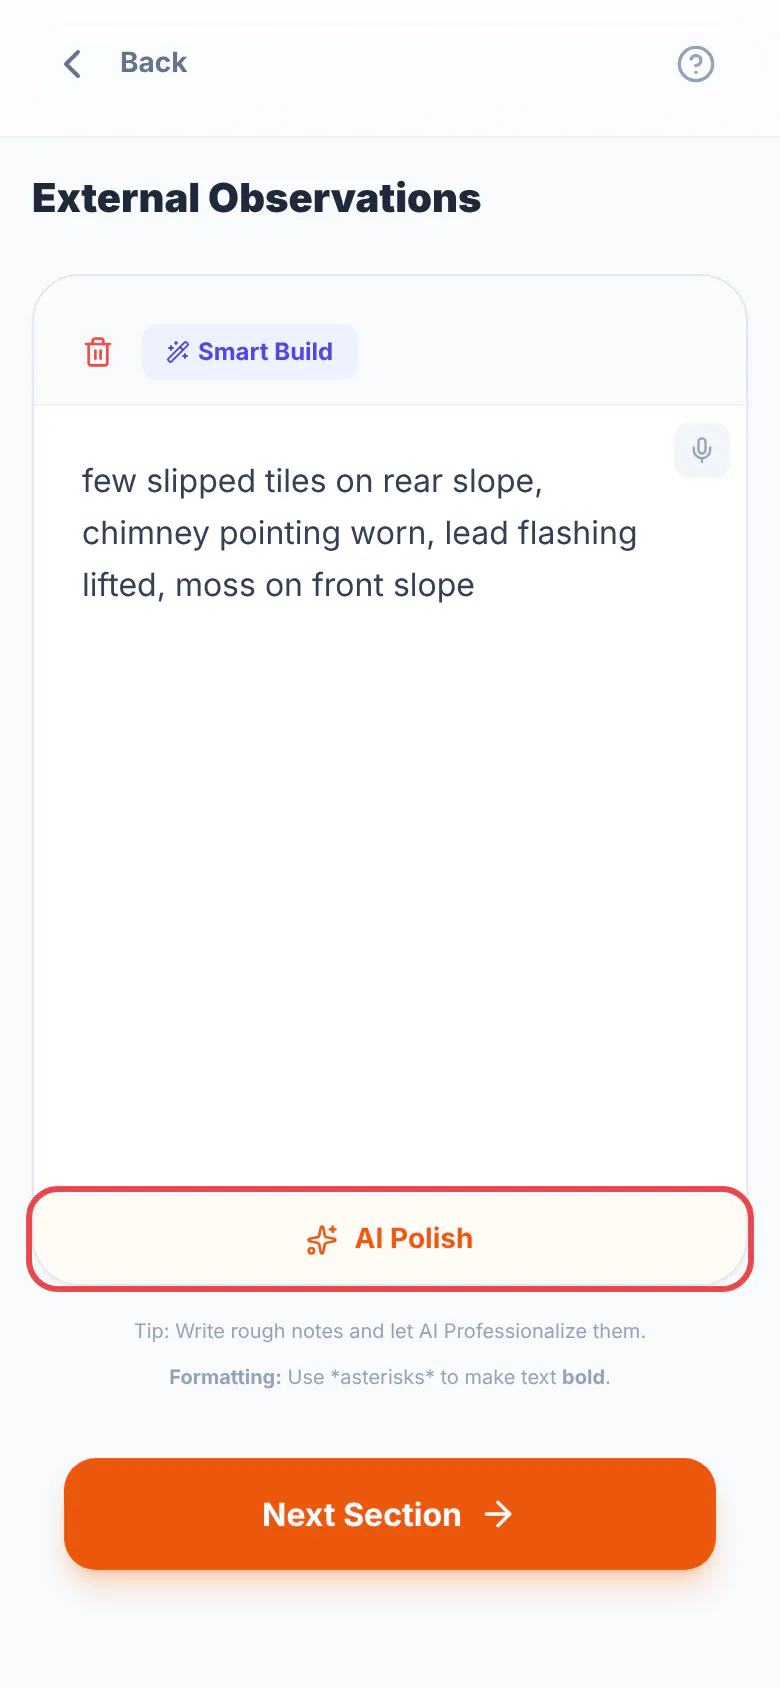
Where it is relevant, the wording refers to the standard that applies in your region, such as the Decent Homes Standard or MEES.
Photo analysis (General Inspections): in a room or external area, tap “Analyse Images with AI”. The AI suggests a description of what it can see, for you to check, edit and use.
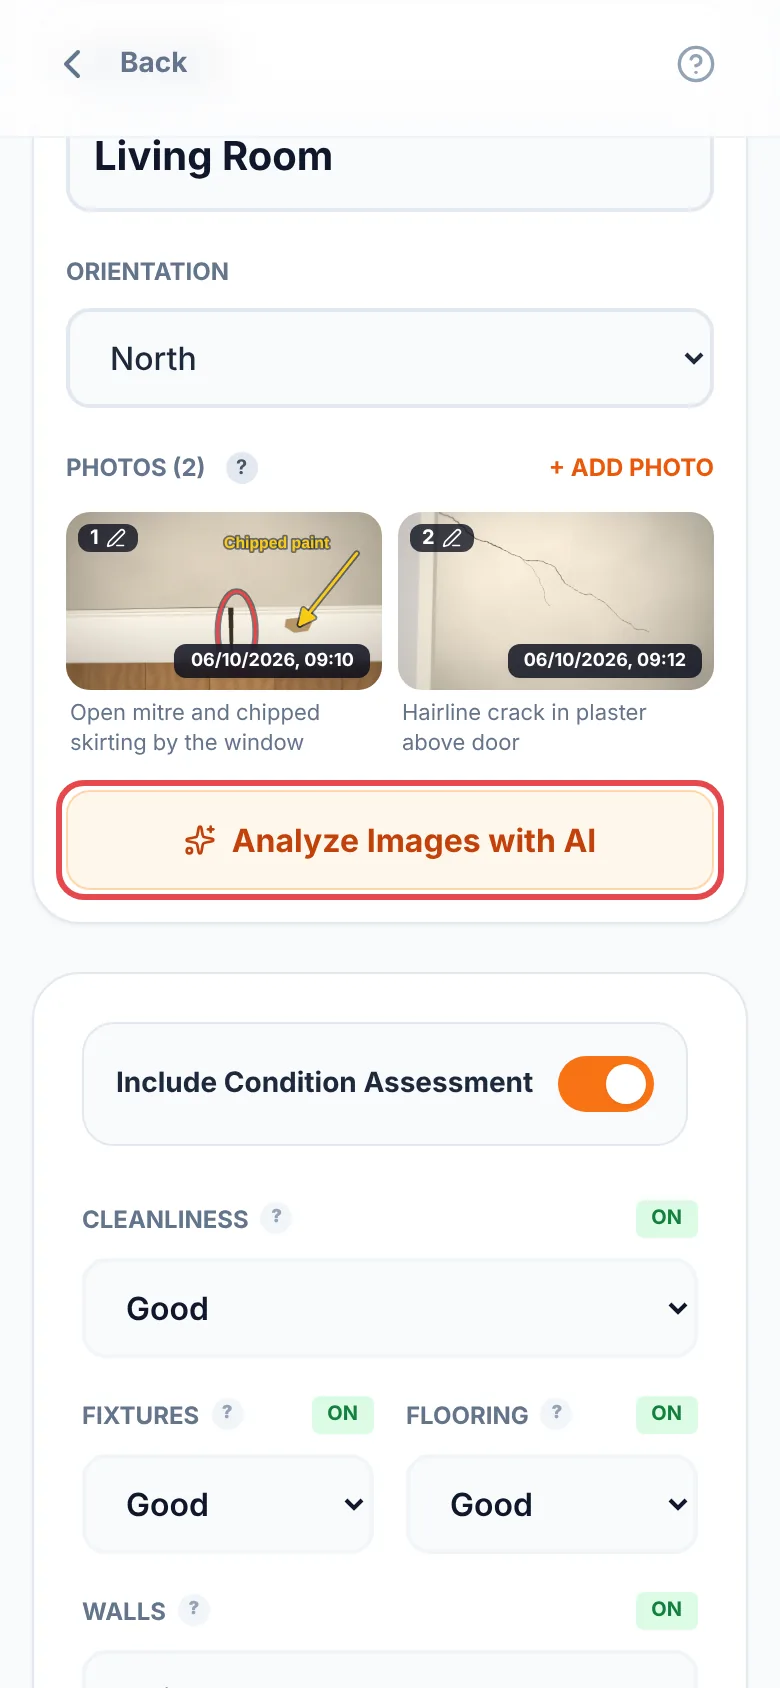
Always check AI output
AI can be wrong. Treat every result as a draft and correct it against what you saw on site.
How many uses you get: How much AI can I use?
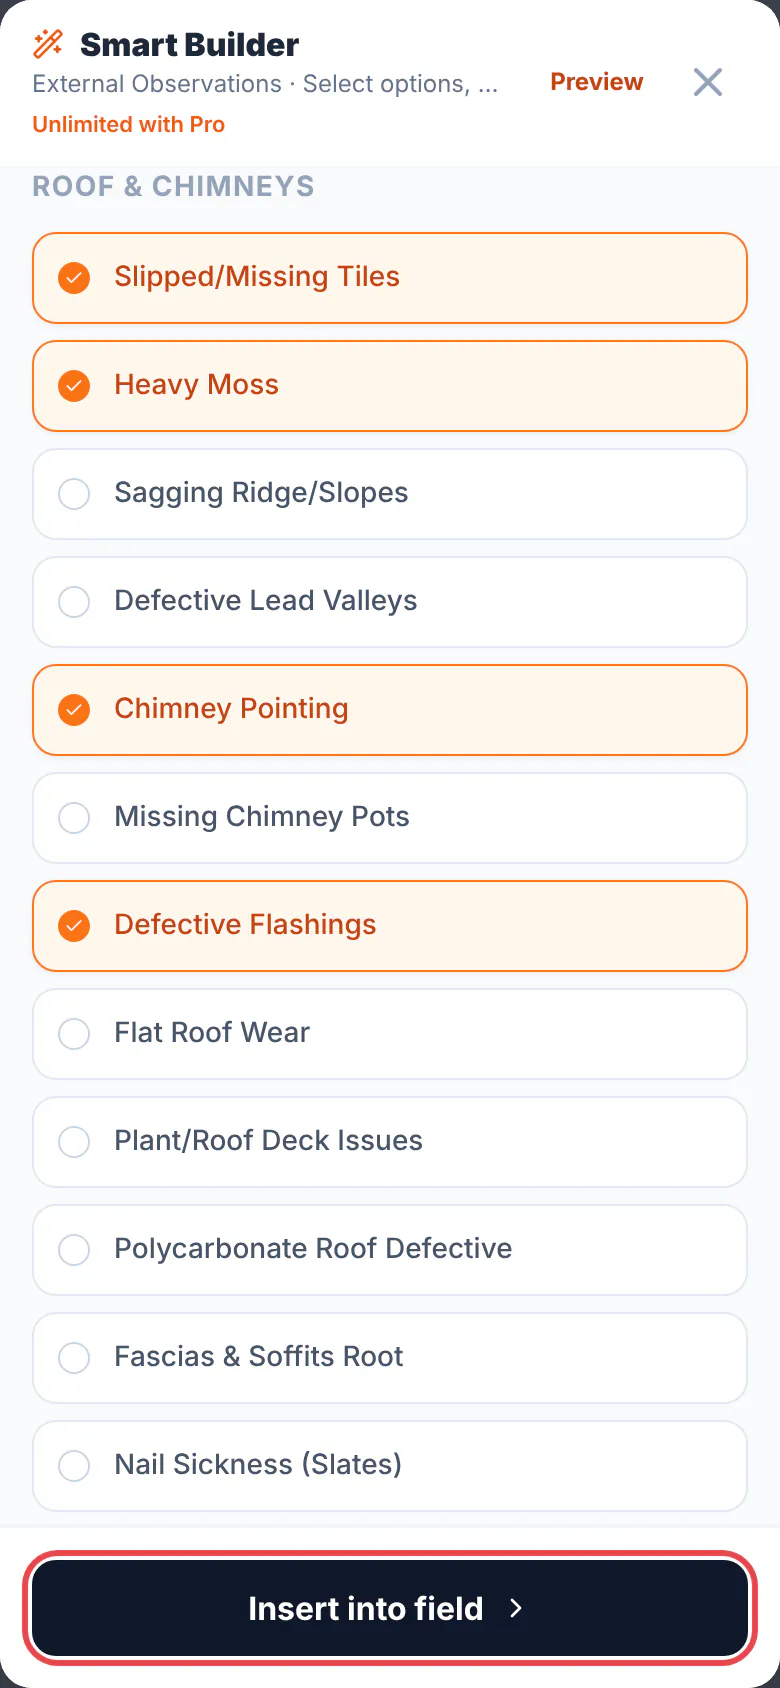
Smart Build (the magic-wand button beside a text box) fills it from a few quick choices, using standard wording for common findings, limitations and next steps. It is standard template text, not AI. In Home and Commercial surveys each field has its own options, including commercial terms such as HVAC, three-phase electrics and curtain walling. In General Inspections it is also under a room's or area's observations, recommendations and maintenance boxes, where it adds to the end of what you have typed, and under photo captions. Edit the result to fit the property.
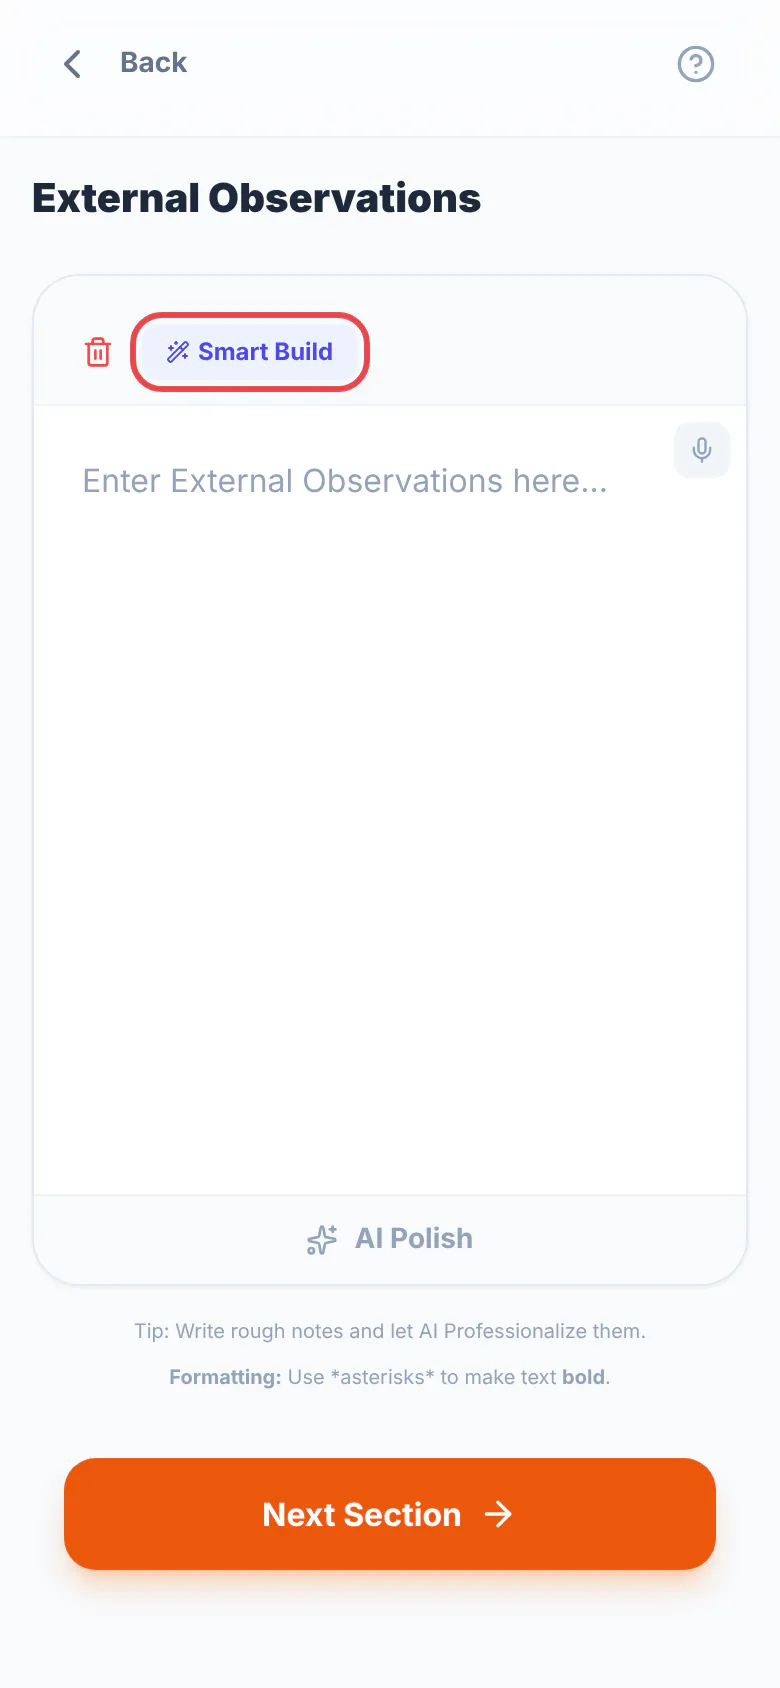
- Free: Smart Build on a few reports each month. Once a report has used it, that report keeps it. Smart Build shows how many you have left.
- Pro: every report, and your default report wording in Settings.
- Smart Build for your company introduction in Settings is always free.
In a General Inspection report for Saudi Arabia, the UAE or Qatar you can add an Arabic translation of the executive summary; for India, a Hindi one. Elsewhere the button does not appear.
- Tap “Generate Report” and scroll to the executive summary.
- Tap “Generate Arabic summary” or “Generate Hindi summary”.
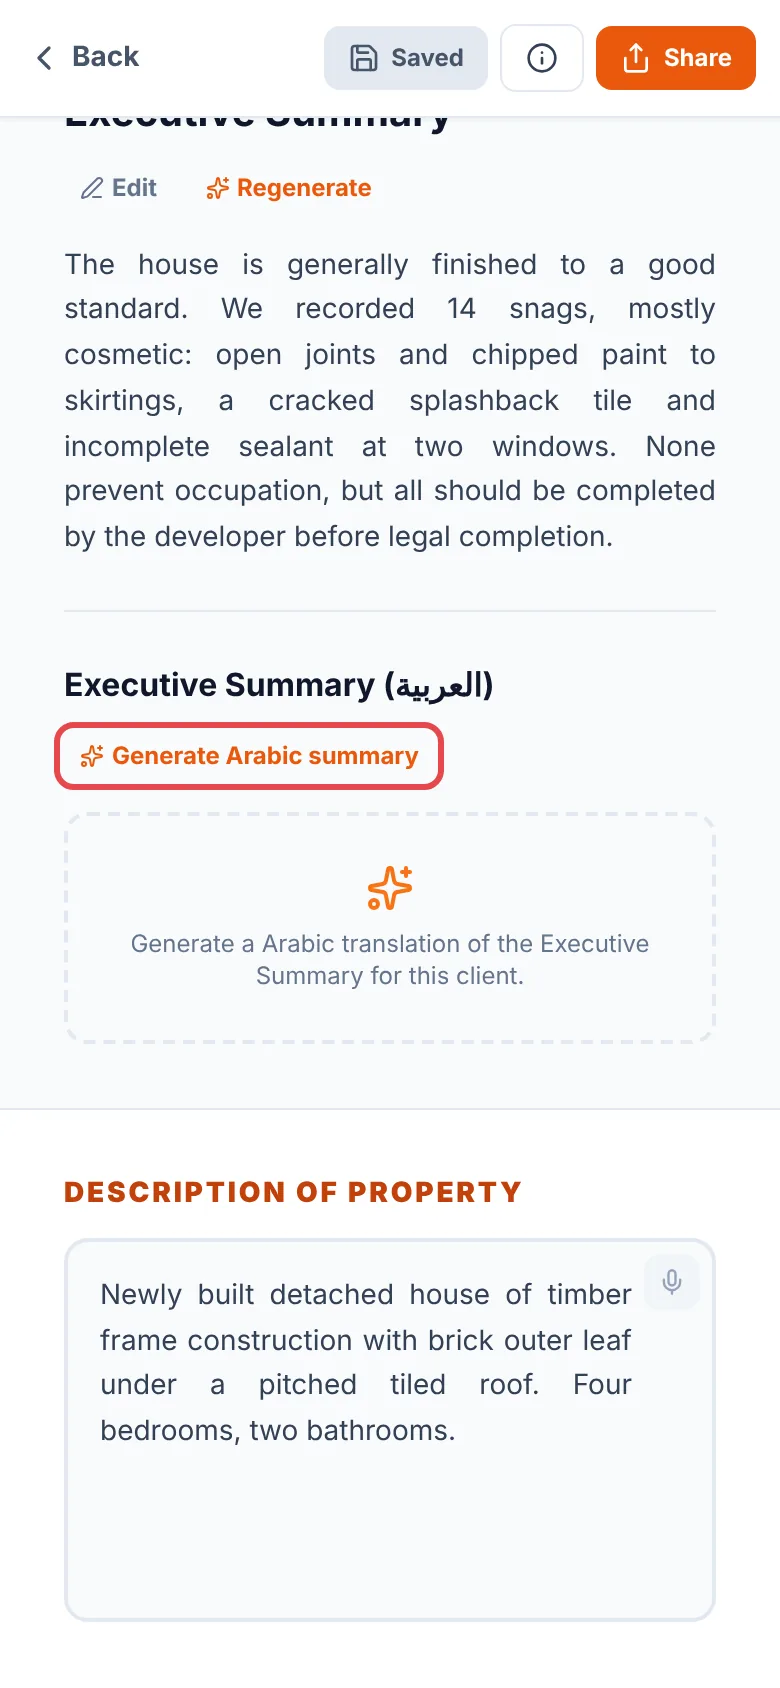
The translation appears under the English summary in the report and the PDF, right to left for Arabic. It uses one of your AI uses (allowances). If you can, have someone who reads the language check it before it goes out.
Tap the microphone under a text box (on the larger survey fields it sits in the box's top corner) and speak. Your words appear as you talk and are added after anything already in the box, so nothing is overwritten. Tap it again when you have finished.
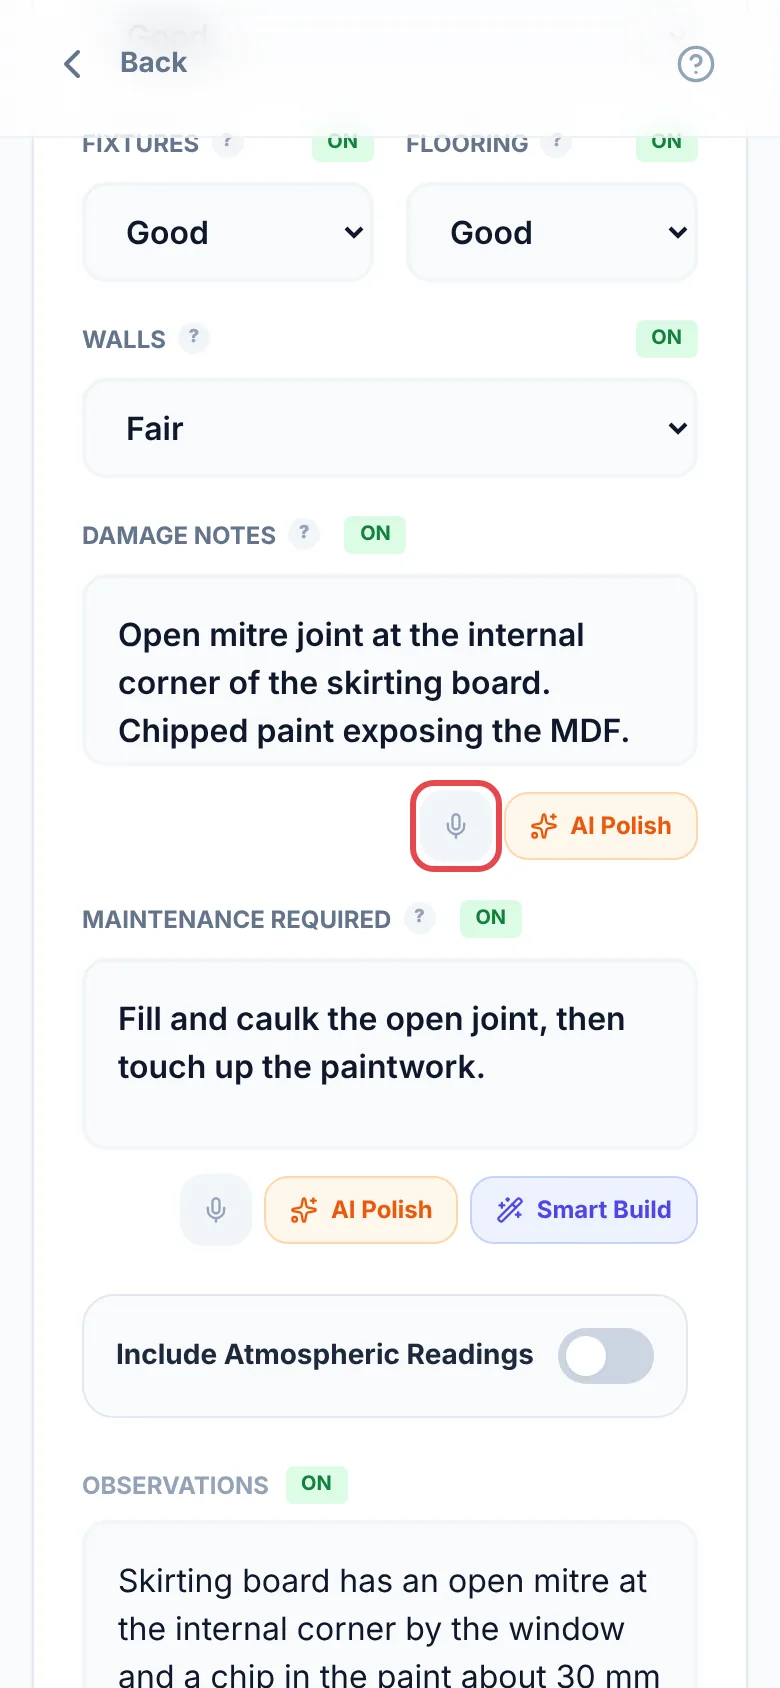
- Your phone asks for microphone permission the first time.
- Dictation listens for British English, whatever your region.
- It uses your phone's own speech recognition (Apple or Google), which may process the audio on their servers.
- Tap “AI Polish” afterwards to turn spoken notes into report wording.
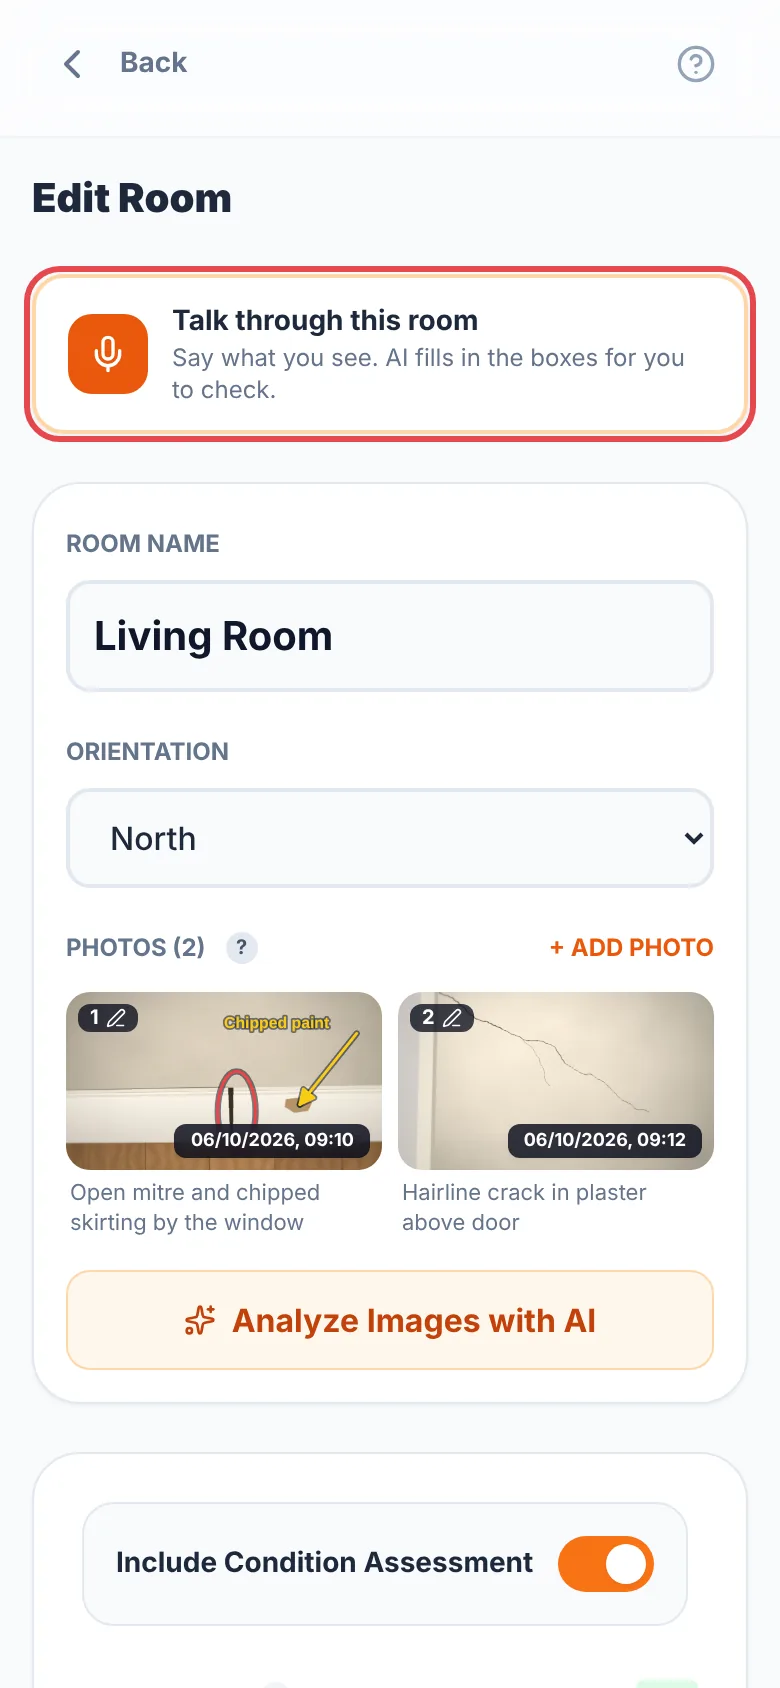
Where to find it:Open a General Inspectiona room or outside areaTalk through this room
Say what you see and the readings you took, and AI sorts your words into the right boxes for you to check.
- Tap “Talk through this room” (or “Talk through this area” outside) and speak. Your words appear as you talk. Tap Stop, then fix any misheard word or type instead.
- Tap “Fill in the room”. Under “Check before it goes in” you see only the boxes you spoke about, each with a tick. A box that already has words offers to add to the end or replace.
- Untick anything you don't want, then tap “Apply selected”. Nothing changes until you do.
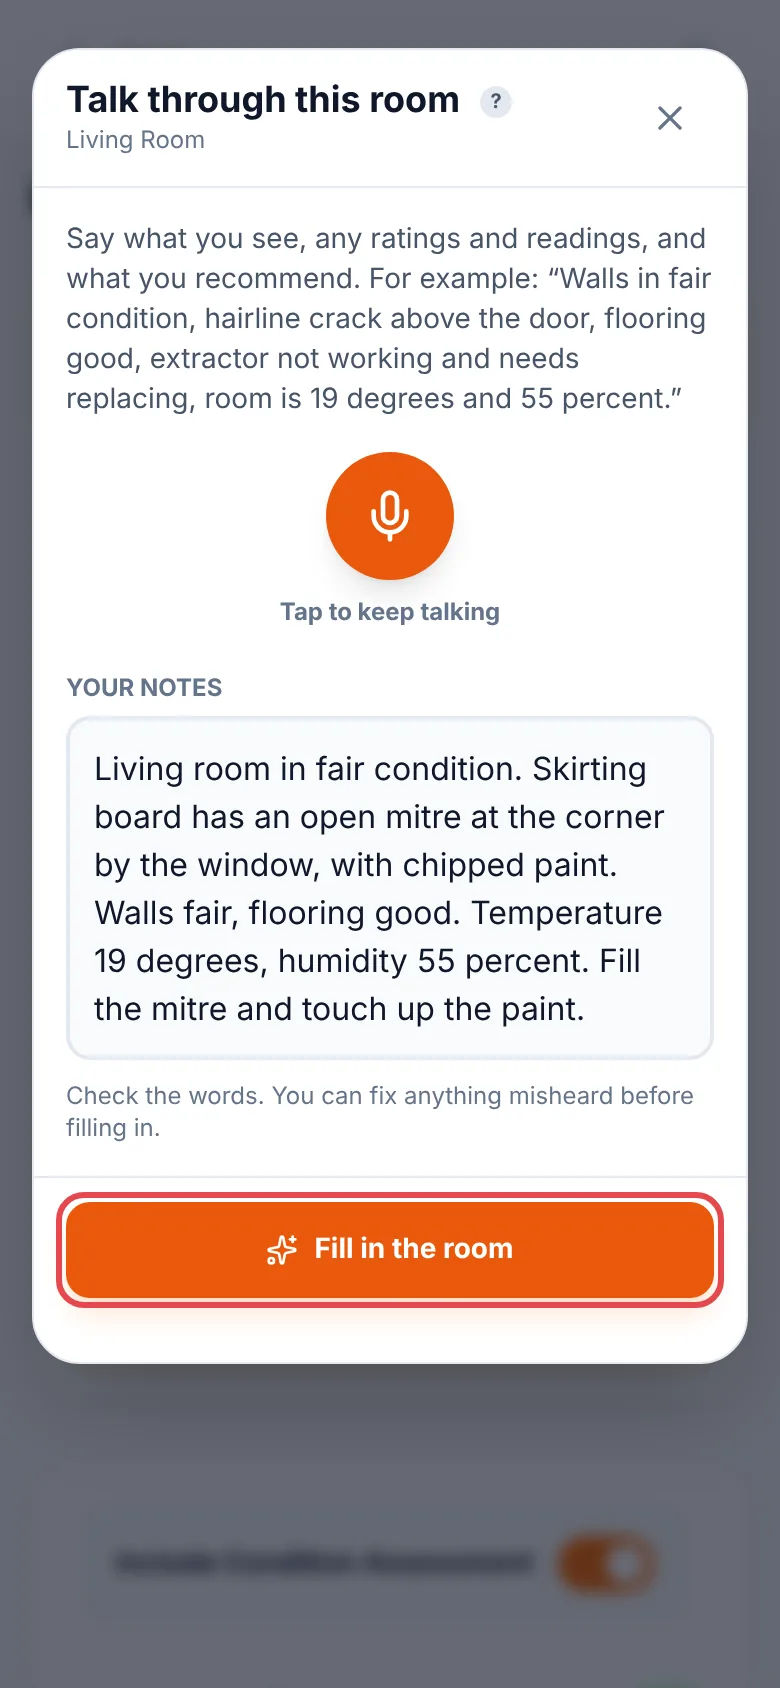
- It can fill condition ratings you say out loud (Excellent, Good, Fair or Poor), temperature, humidity, observations, moisture readings and recommendations.
- Free includes 3 a month. Pro uses it daily, or without our limit using your own AI key.
- It needs an internet connection. If the AI can't be reached, your words are kept and “Add my words to Observations” puts them in as spoken.
Where to find it:SettingsLanguage & Region
A plain-English list of the standards and legal duties for your region, grouped by topic. Open it from “Standards & Regulations” on Home, under Start New Survey, or under your region in Settings. For the UK that includes the RICS Home Survey Standard, MEES and EPC rules, the Decent Homes Standard, and condition and dilapidations references. Each entry explains the key points and links to the official source. It updates without an app update.
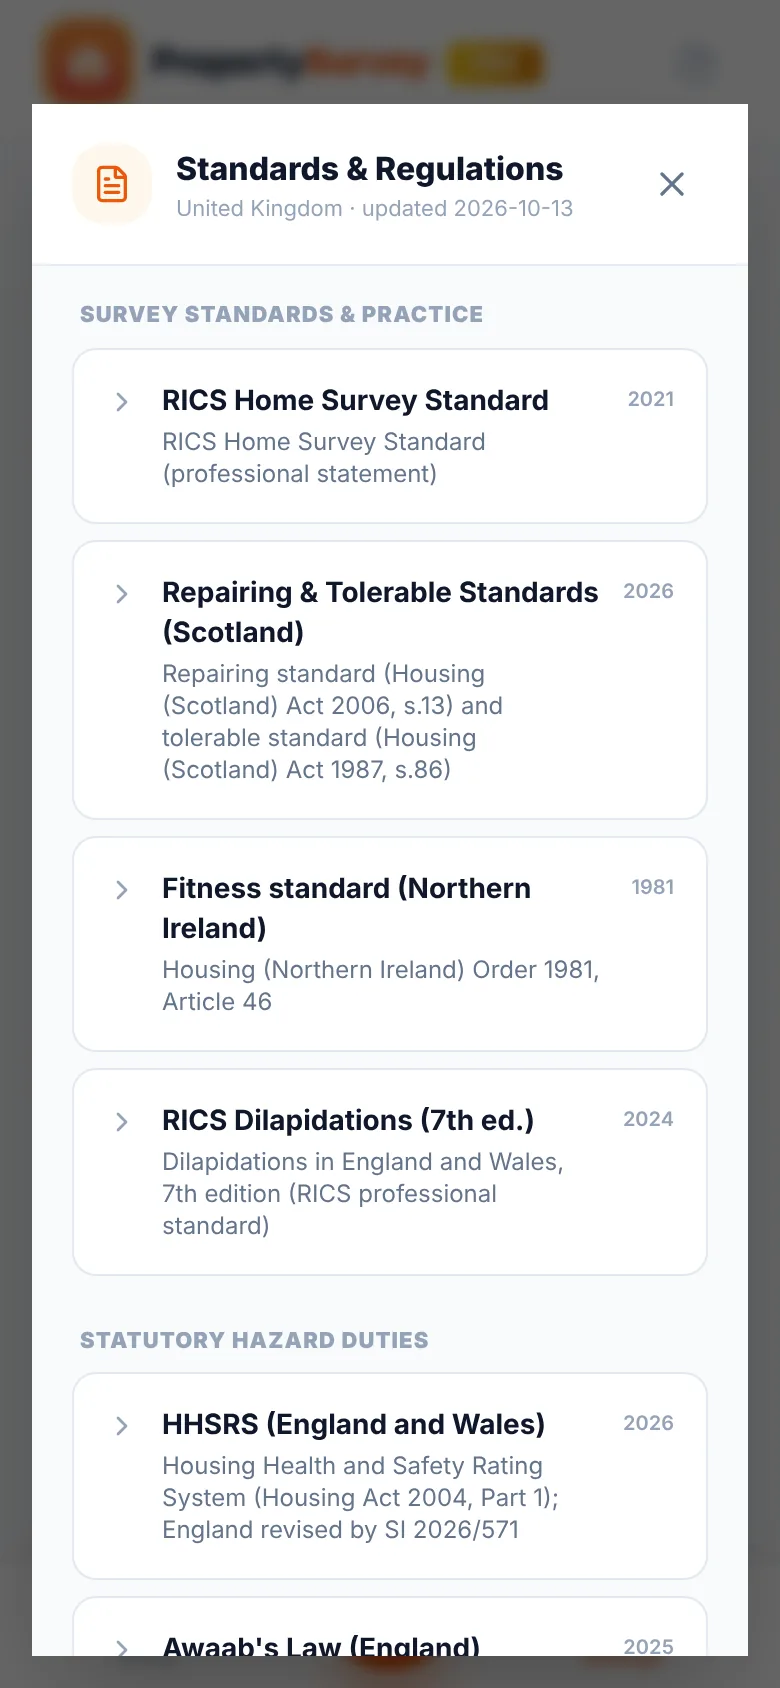
These are the same standards the AI refers to in your report wording.
Reports: preview, branding & sharing
Checking, branding, signing and sending the finished PDF.
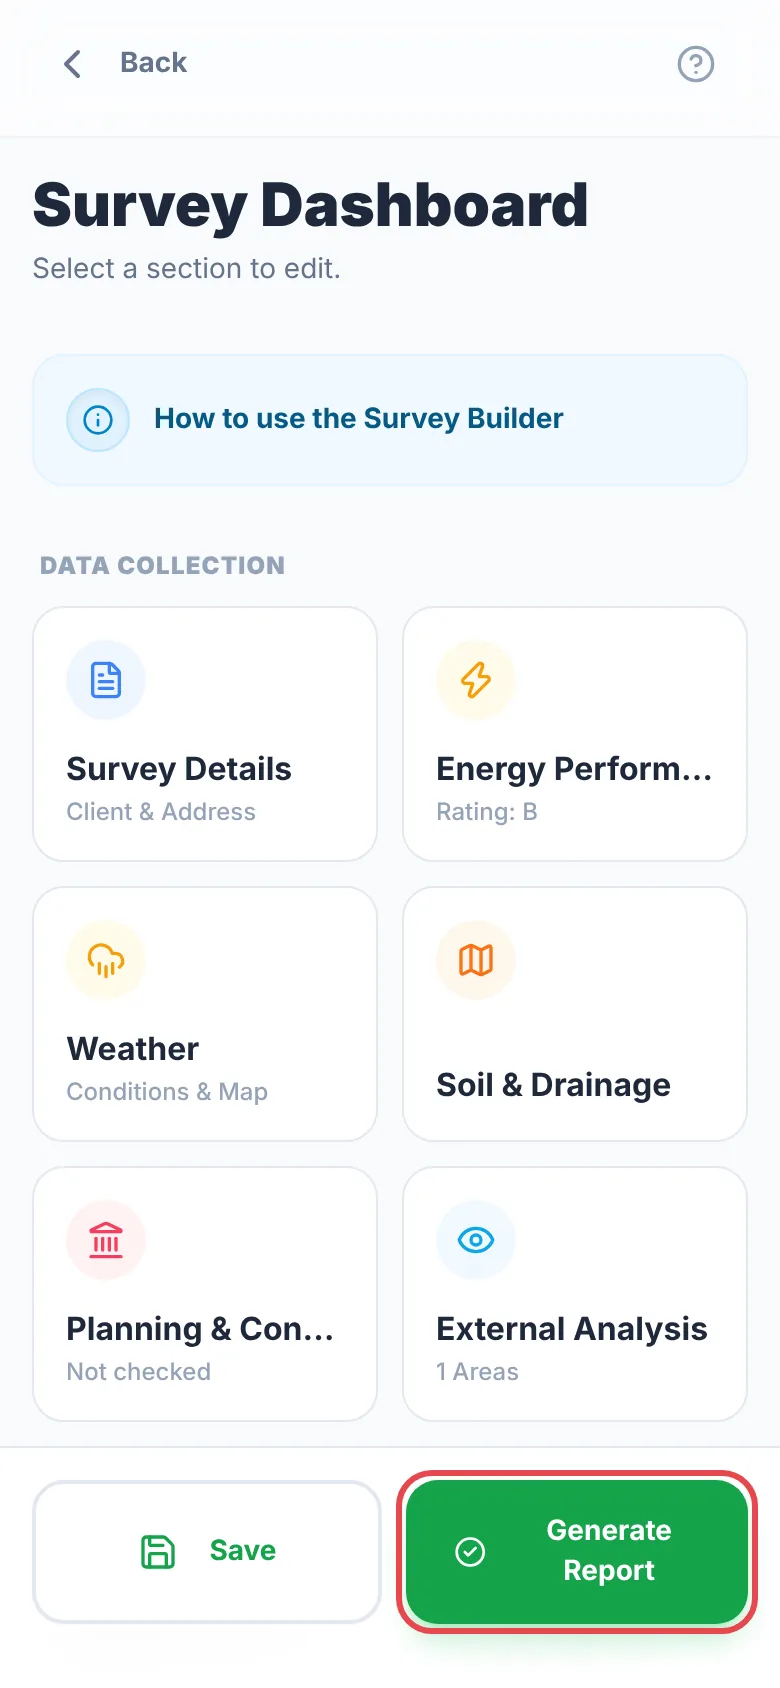
- General Inspection: tap “Generate Report”.
- Home or Commercial: tap “Review report”, or open “Readiness & report”, check the list of anything missing, and tap “Finish & report”.
- The report opens as your client will see it. Read it through: names, dates, photos, ratings and recommendations. You can correct text in the preview.
- Tap “Save”. The “Share” button (and the email button, if you have set up email) appears once everything is saved.
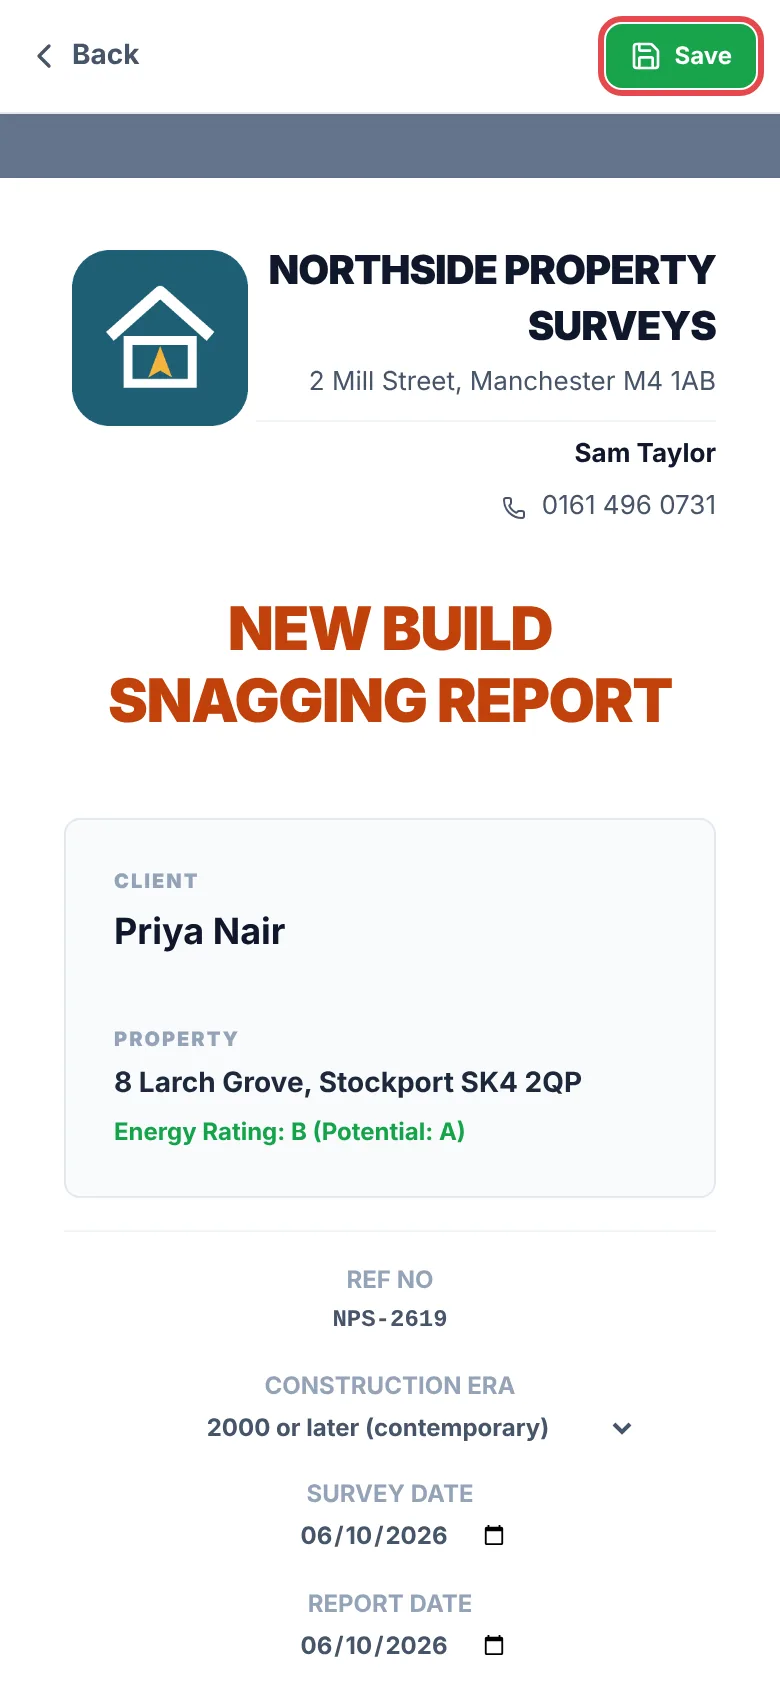
Home and Commercial reports start as Draft. Change the status to Final only after your review.
In the saved report, tap “Share”. Your phone's share menu opens with the PDF, so you can:
- save it to Files, iCloud Drive, Google Drive or OneDrive;
- send it by your email app, WhatsApp or Teams;
- print it to a wireless printer.
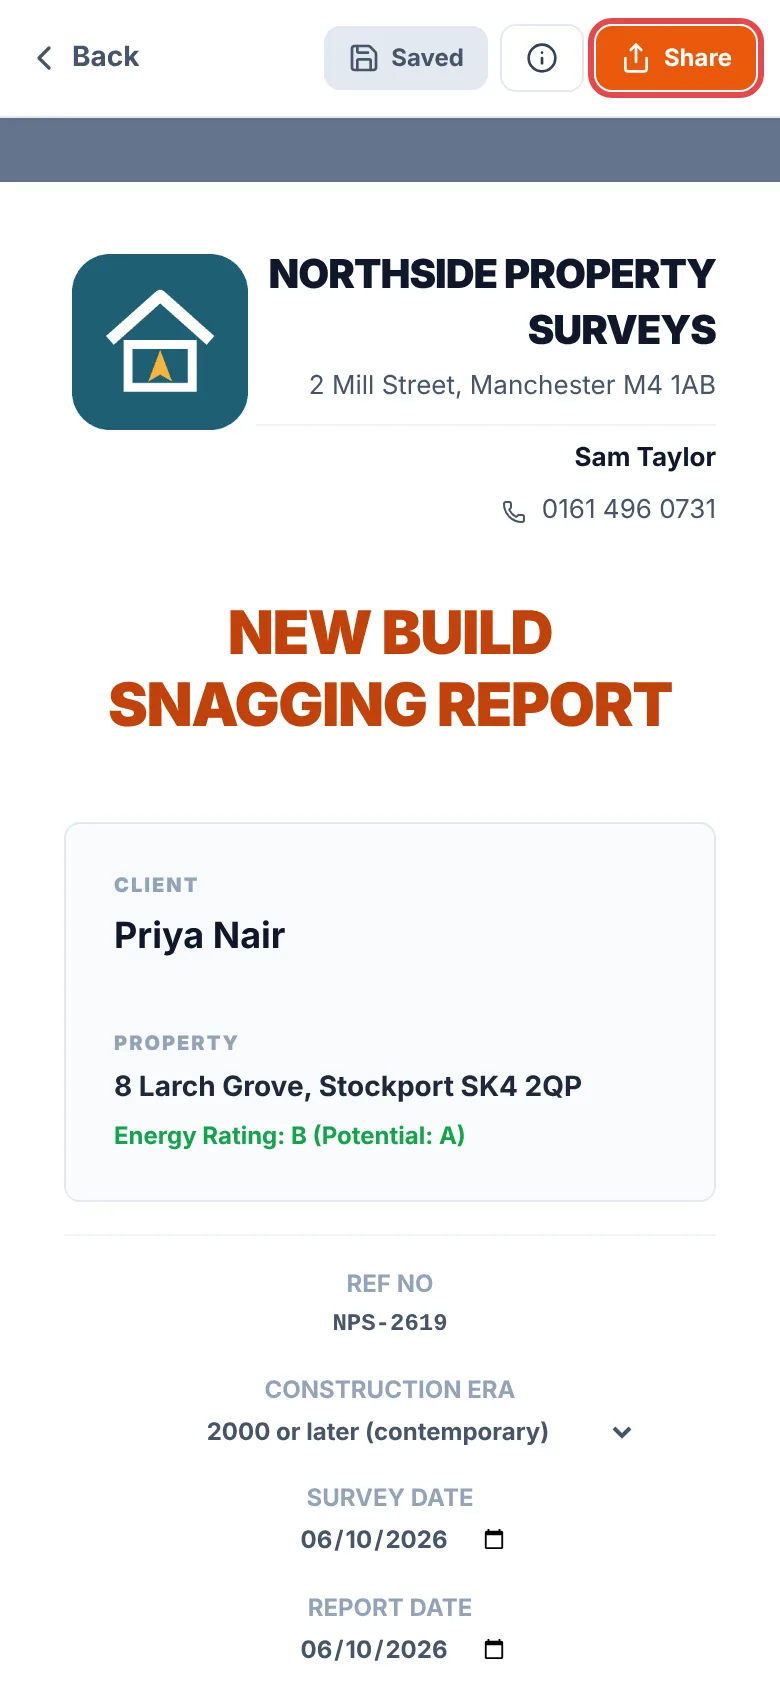
When the report has a Scott schedule, “Share” first asks what to send: the full report, the report and the schedule as two PDFs, the report only, or the schedule only. When you email a report, choose which one to attach.
Sharing is free. On Free, the first time you may see a one-off note about the PropertySurvey Pro™ footer on the report.
Opened on a computer or tablet, the PDF lists every section, and each area and room under it, in the viewer's sidebar or bookmarks, so a reader can go straight to the part they need. Its properties carry the report's title, your name and the report's language.
To send straight from the app under your own email address, see Email reports from your own address.
Where to find it:SettingsIntegrationsEmail SendingSMTP Settings
This sends reports from the app using your own work email, so they reach clients from you. You need a few details from your email provider.
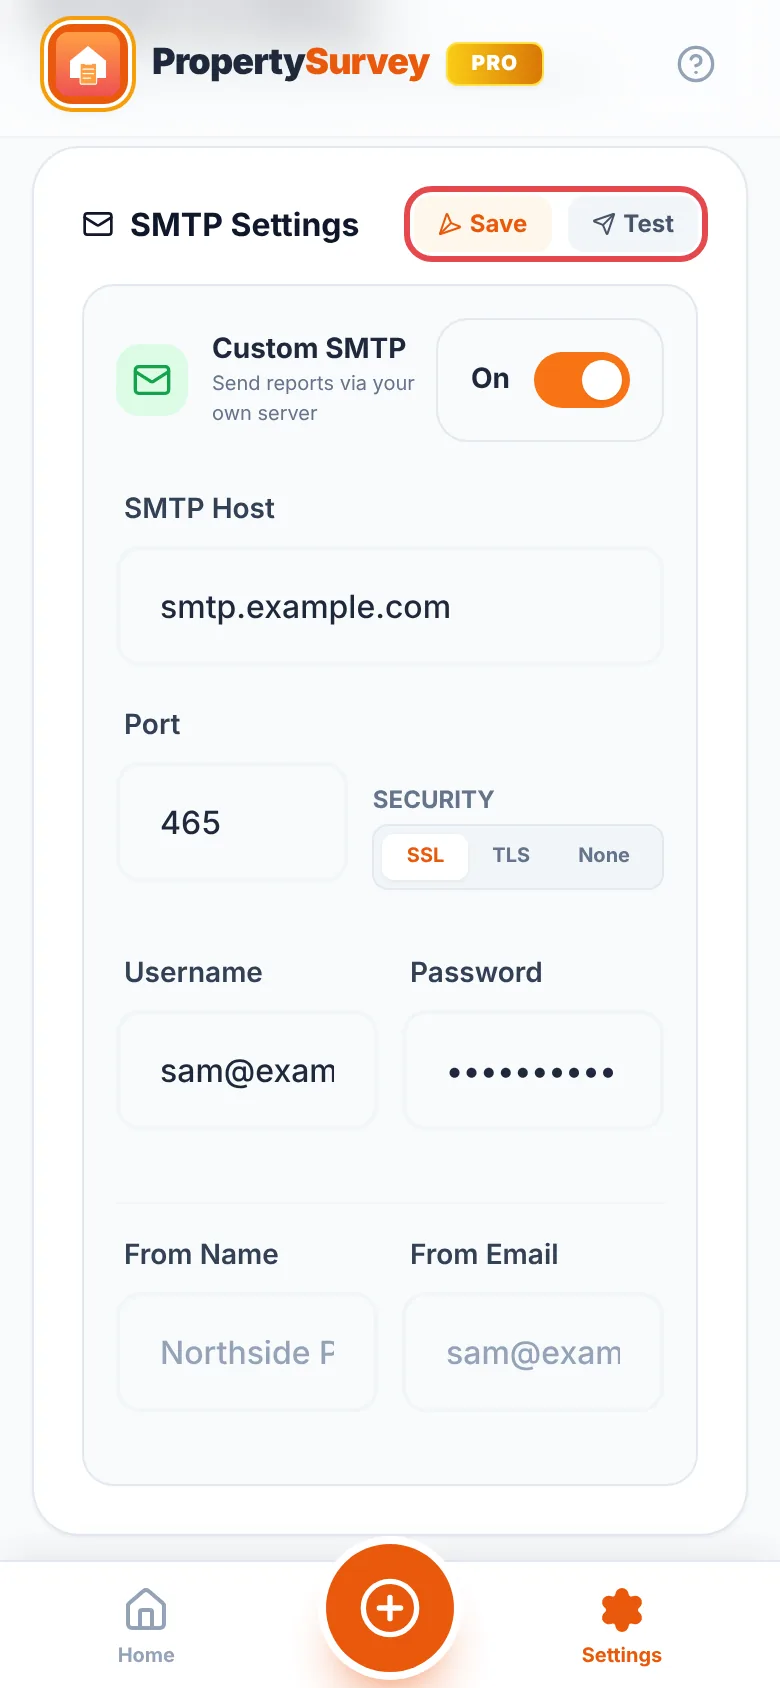
- Switch “Custom SMTP” on.
- Fill in “SMTP Host” (for example smtp.gmail.com or smtp.office365.com), and choose “SSL” (port 465) or “TLS” (port 587).
- Enter your full email address as the “Username”, your password, and the name and address clients should see.
- Tap “Save”, then “Test”.
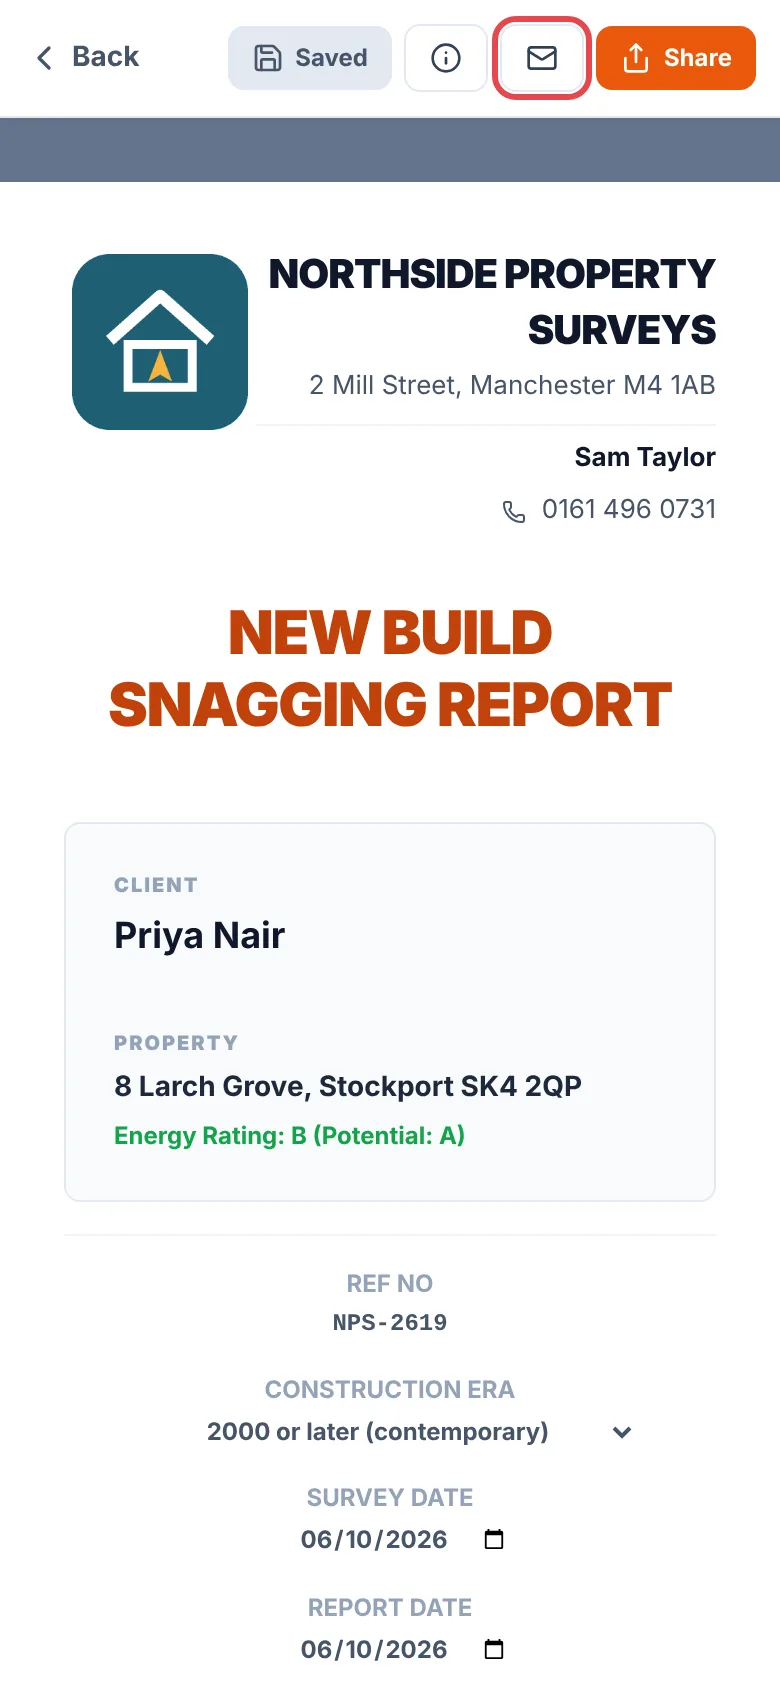
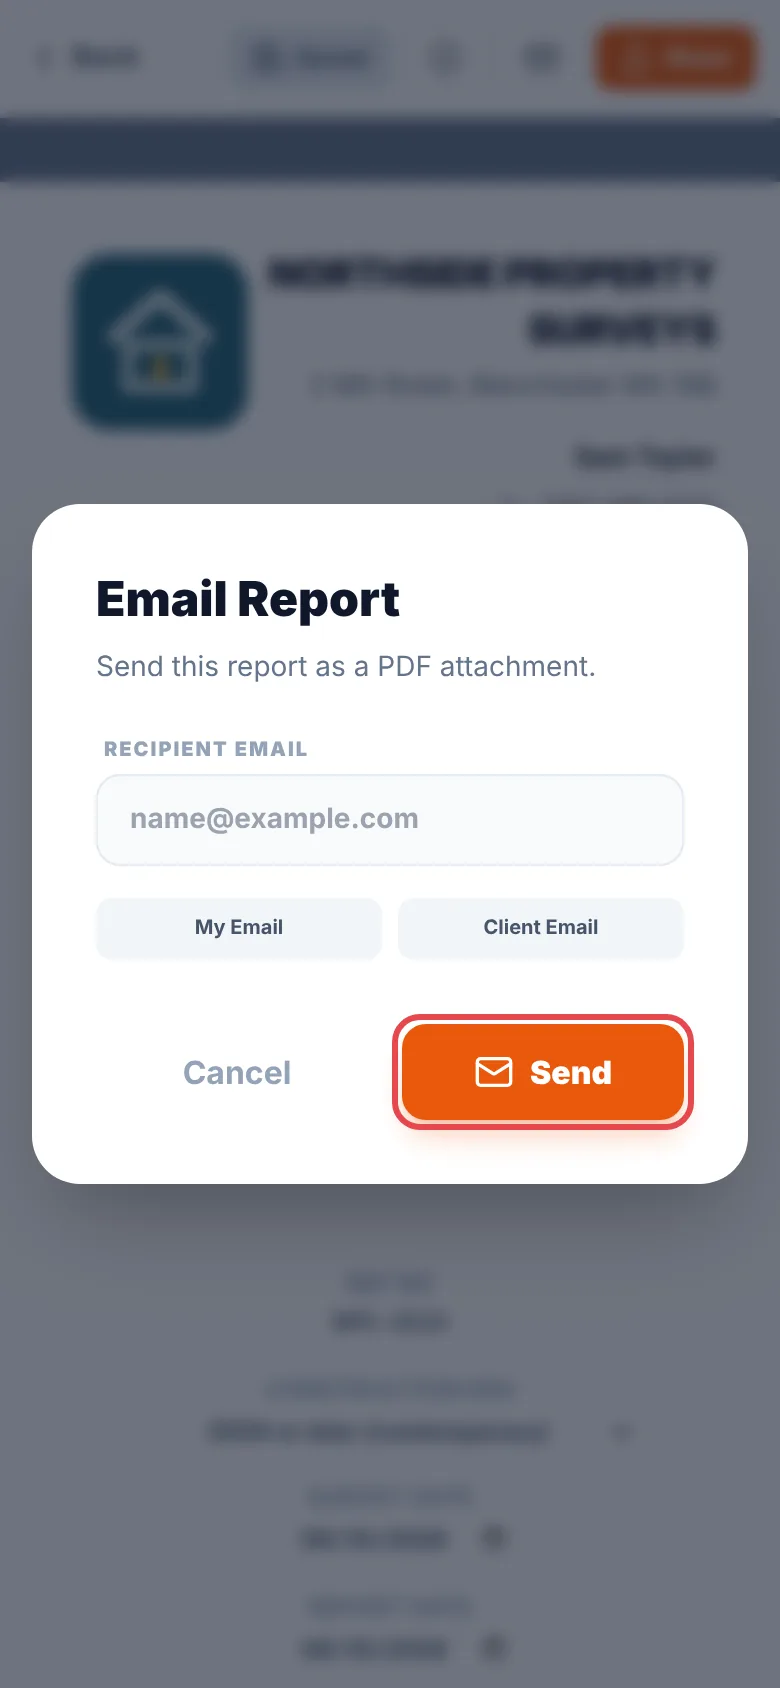
Then, in a saved report, tap “More”, then “Email the report”, choose “My Email” or “Client Email” and tap “Send”.
Gmail and Microsoft 365
If your account uses two-step sign-in, your normal password will not work here. Create an App Password and use that: Gmail App Password (opens in a new tab) · Microsoft App Password (opens in a new tab).
Where to find it:SettingsCompanyLogoUpload Image
Tap “Choose File” and pick your logo. A square or wide logo at least 1,000 pixels across looks sharpest. It appears on the cover and page headers of every report, including Home and Commercial reports. In the page header a very wide logo is drawn smaller, and a long company name in smaller type, so the company details beside it stay on the page.
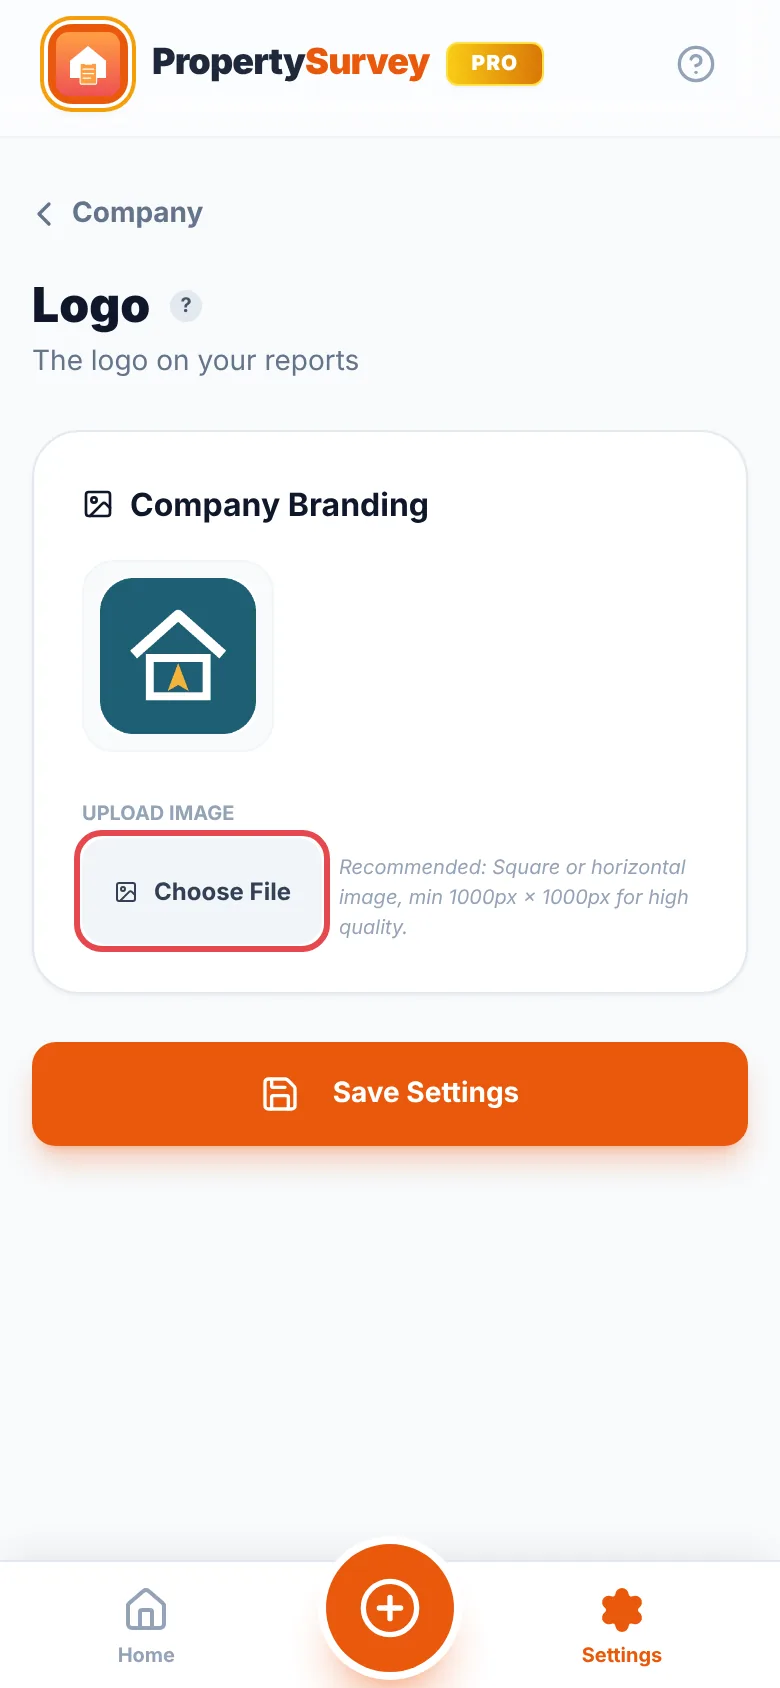
On Free, reports show your company name instead.
Where to find it:SettingsReportsPDF Look
- “Theme Colour (Headers & Accents)”: pick one of five colours, or choose your exact brand colour.
- Typography: six fonts; the standard one is “Modern (Helvetica)”. They work offline.
- Cover layout: the shaded “Standard Header” or the ink-saving “Minimalistic Header”.
- Sections: SettingsReportsVisible Narrative Sections is next to “PDF Look”. Untick sections you never use, such as Weather or EPC, and they disappear from the survey and its report. The list is grouped into sections every survey type has and sections only the general report has. Home Survey and Commercial reports always keep their core parts, such as the condition ratings, legal matters, risks and declaration.
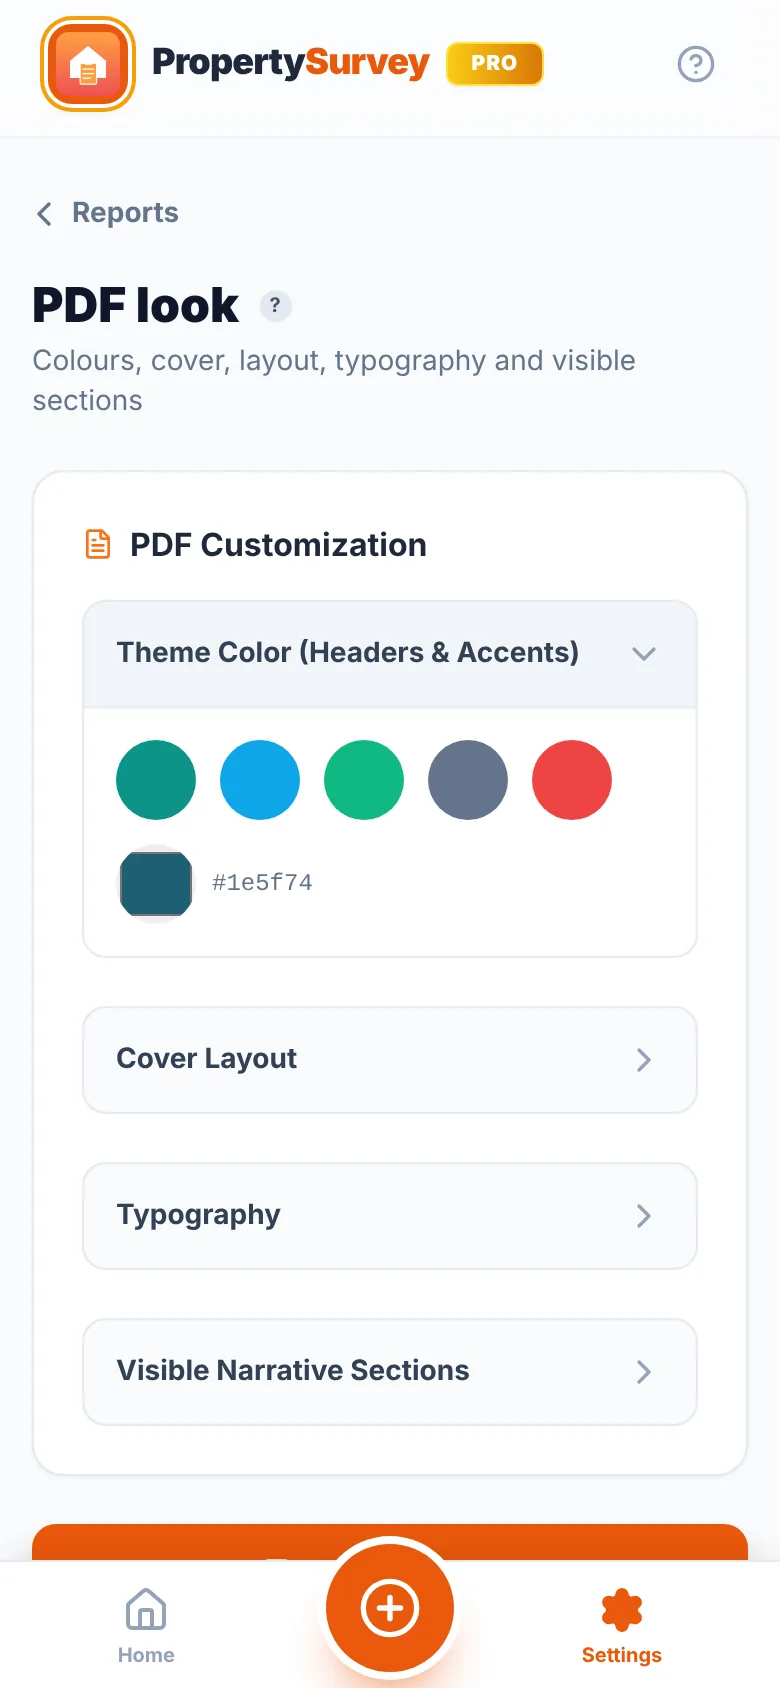
Your font, colour, cover and logo carry through to Home and Commercial reports too. Pro reports also drop the Produced with PropertySurvey Pro™ footer (“Remove App Branding”, on by default).
Where to sign: General Inspection: “Final Sign-Off”. Home Survey: “J Declaration”. Commercial Survey: “D Declaration”.
- Choose “Draw” PRO to sign on screen with your finger, or “Upload Image” to use a photo of your signature.
- Tap “Save to Profile” to keep it. Next time, tap “Load from Profile” instead of signing again.
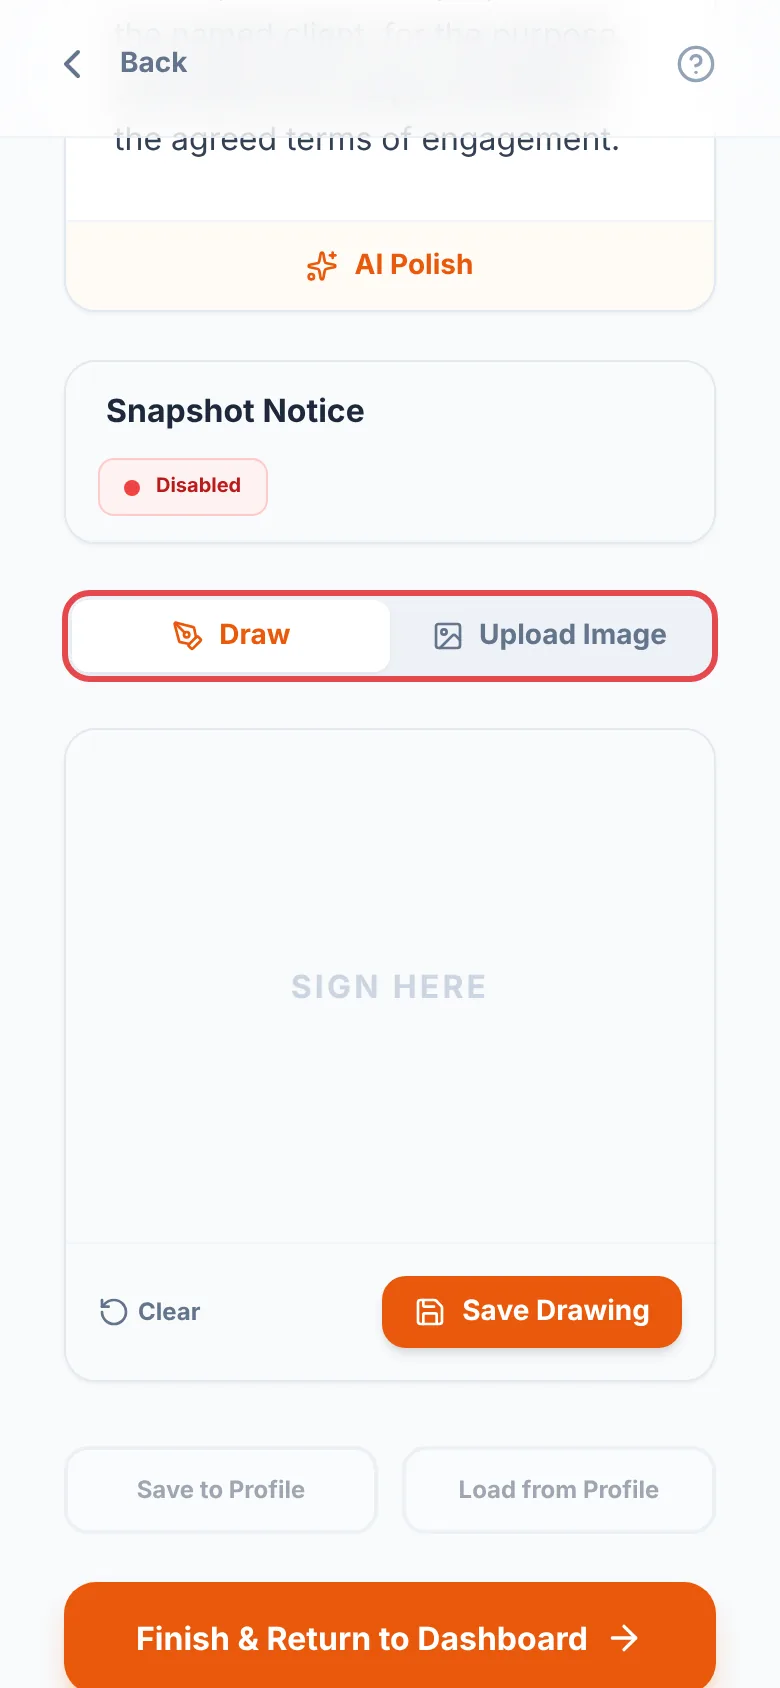
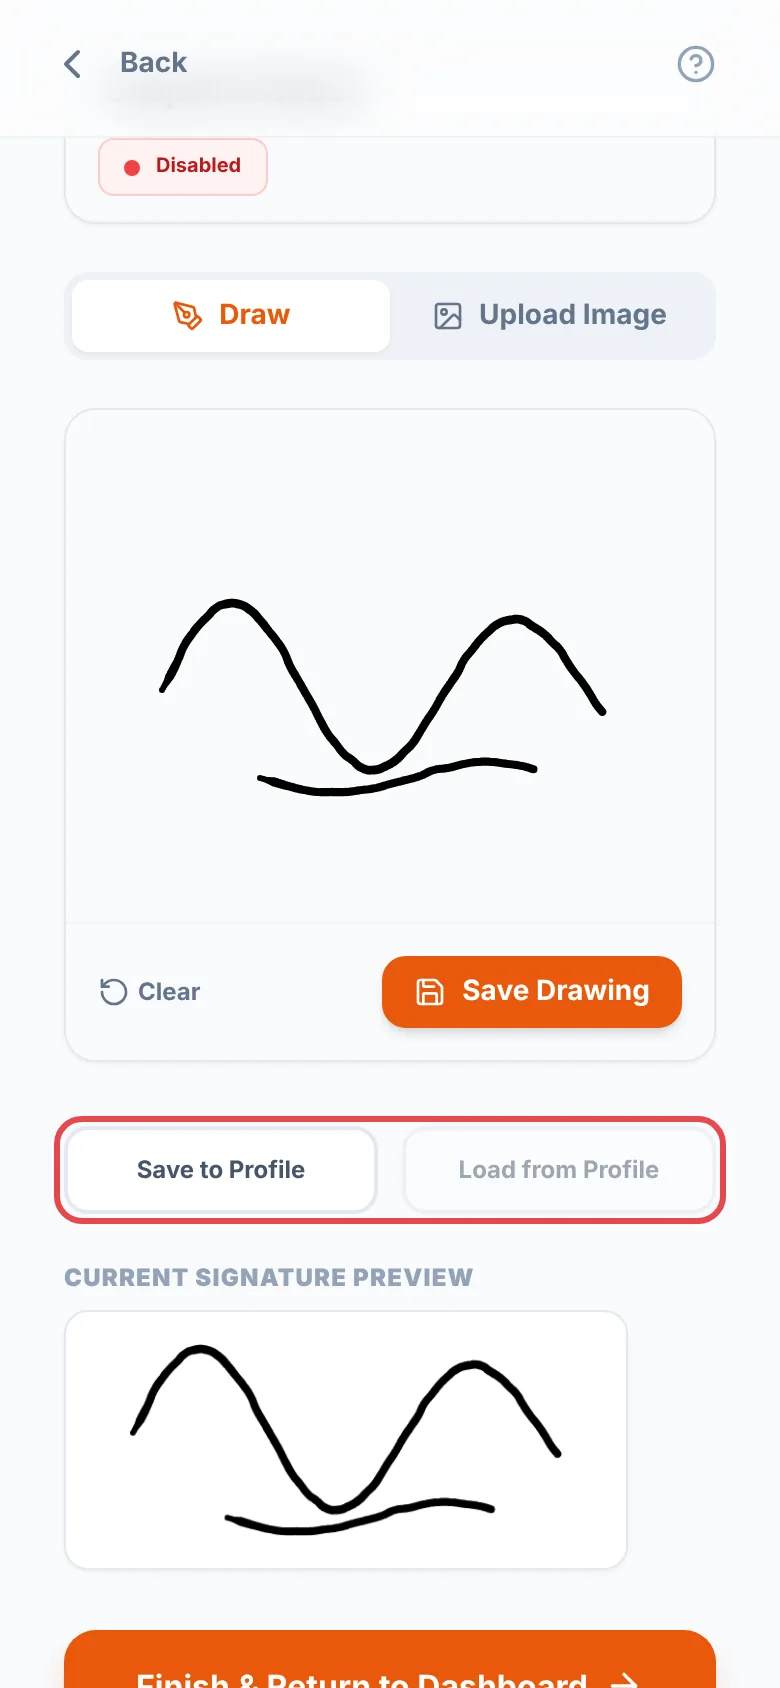
Your signature, name and accreditations appear at the end of the report. A tall signature image is scaled to fit, at most 40 mm high.
To have the tenant, landlord, client or site contact sign as well, turn on Client Sign-Off.
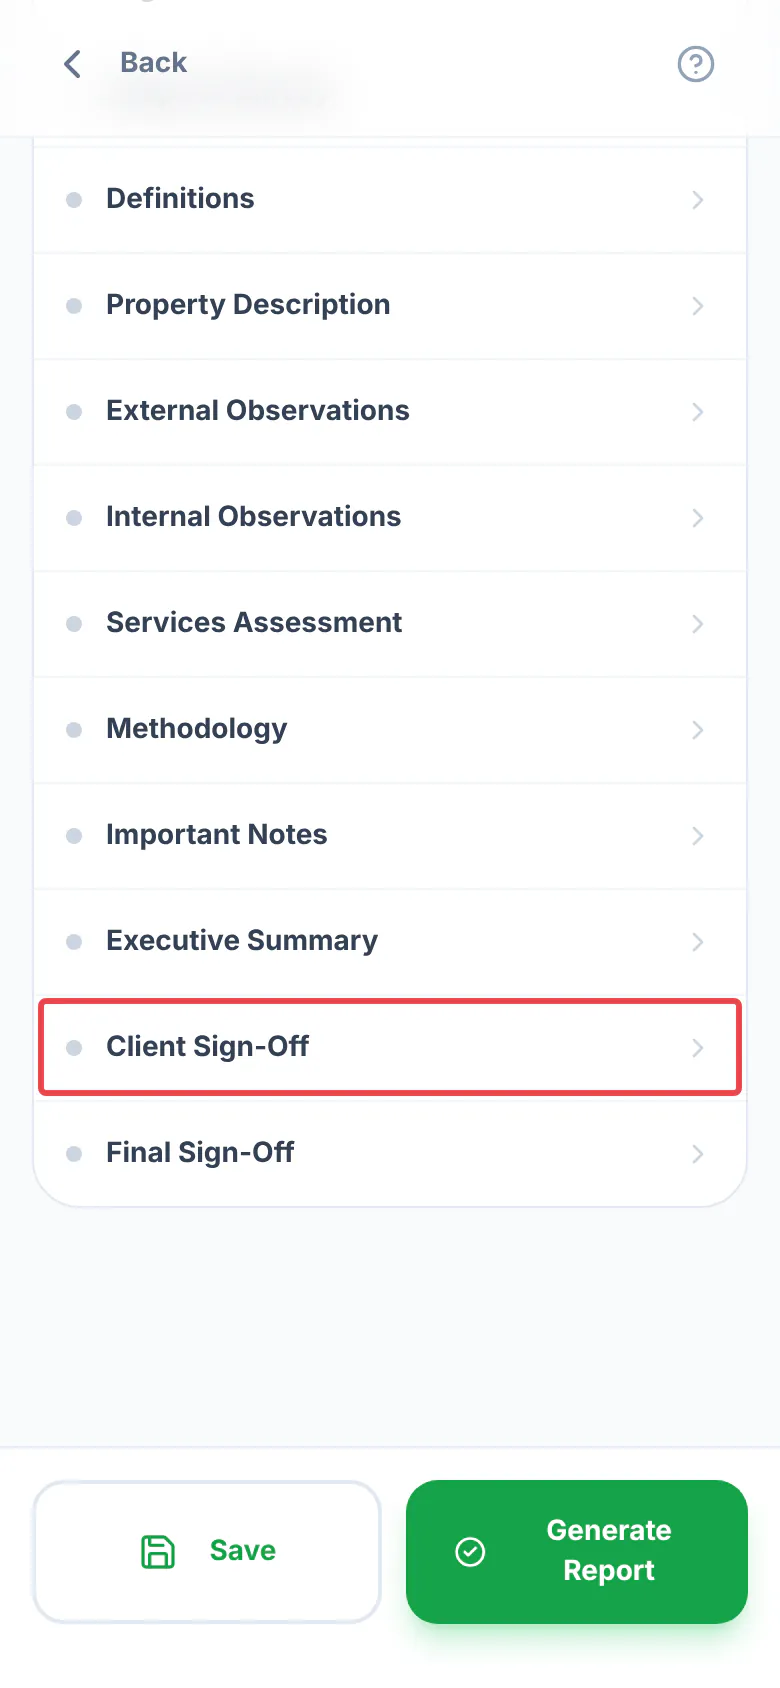
Where to find it:Open a General InspectionReport NarrativeClient Sign-Off(in a Home or Commercial survey: the “Client sign-off” card, just before the declaration)
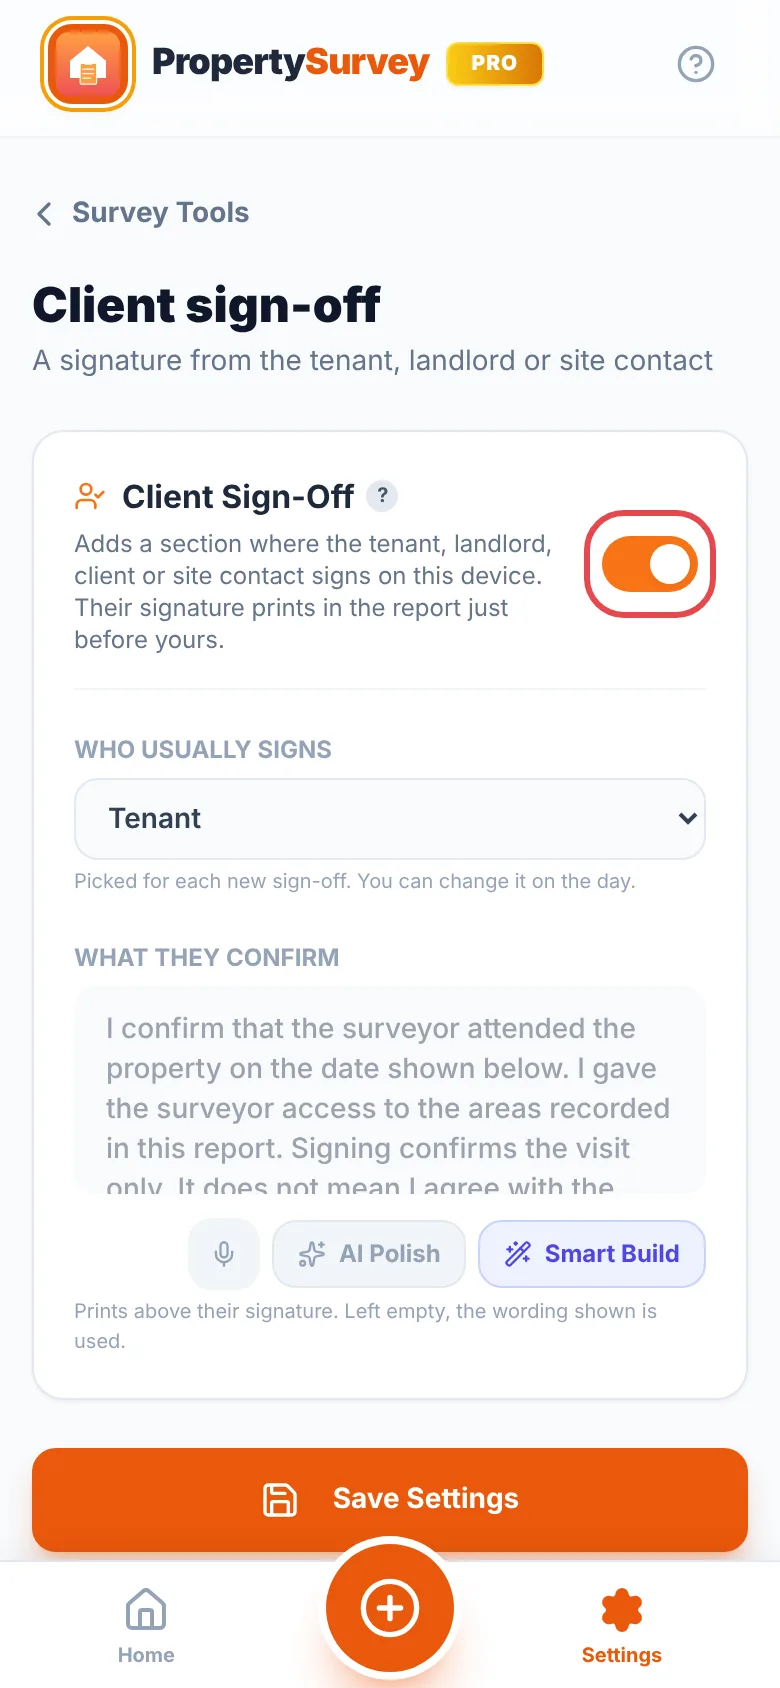
The tenant, landlord, client or site contact signs on your phone or tablet at the end of the visit, to confirm you attended and they gave access, or that the report is a fair record of the property's condition. Their signature prints in the report just before yours. It is free, and off until you turn it on.
- In Settings → Survey Tools → Client sign-off, turn on “Client Sign-Off”. Choose who usually signs, and change the wording they sign under if you like, or tap “Smart Build” to put it together.
- At the end of the visit, open “Client Sign-Off” in the survey. It comes just before your own sign-off.
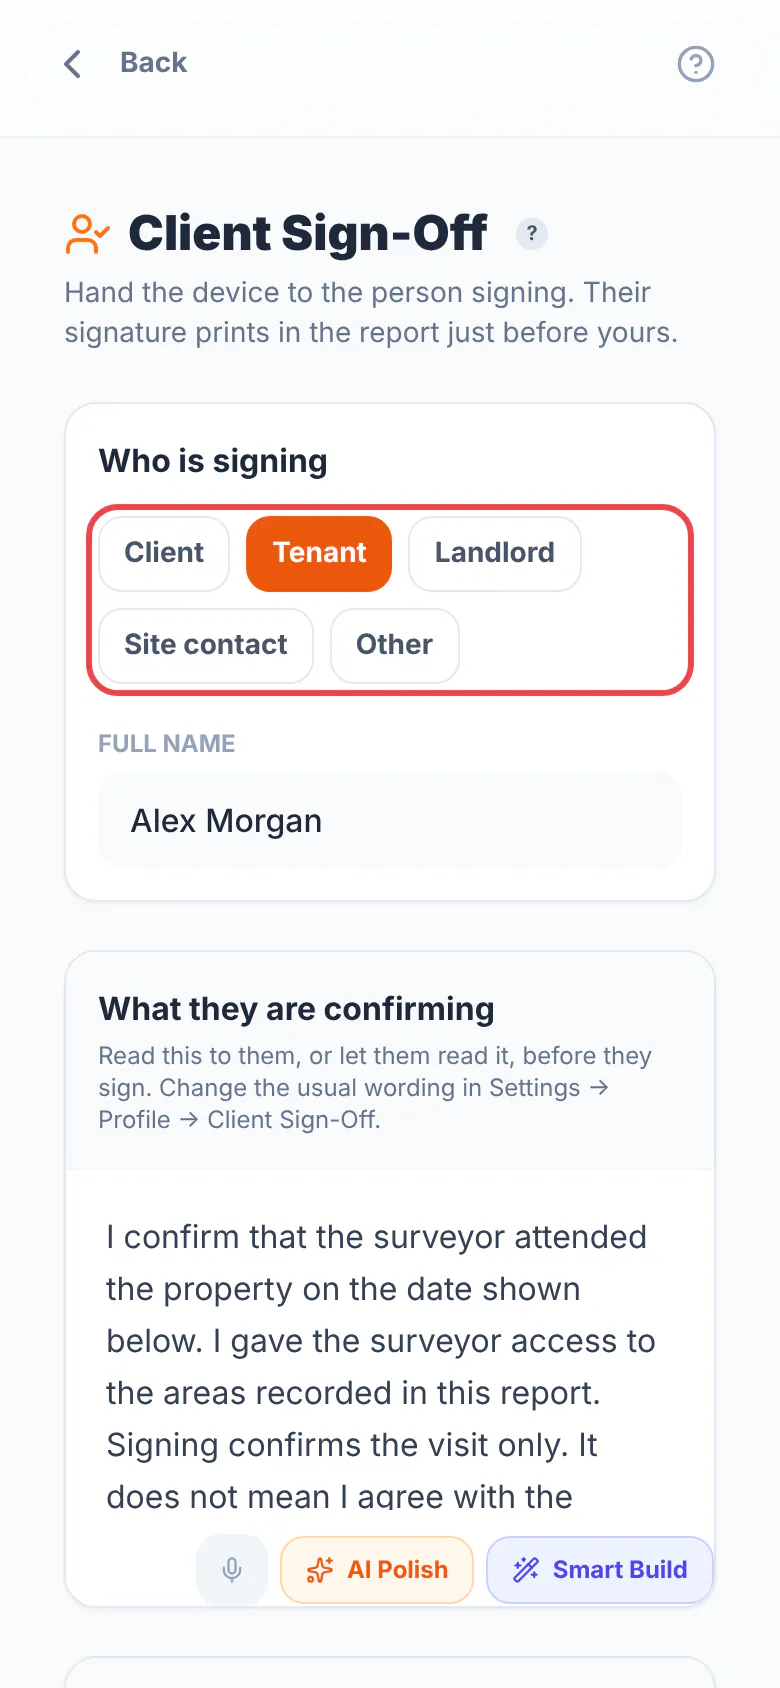
- Pick who is signing. The name starts from the client, tenant or landlord in the survey details; check it, and read the wording to them or let them read it.
- Hand them the device to sign in the box. The signature saves as they sign, with the date and time.
- If they were not there or would not sign, tap “Not present” or “Declined to sign” instead, and add a note if you need to.
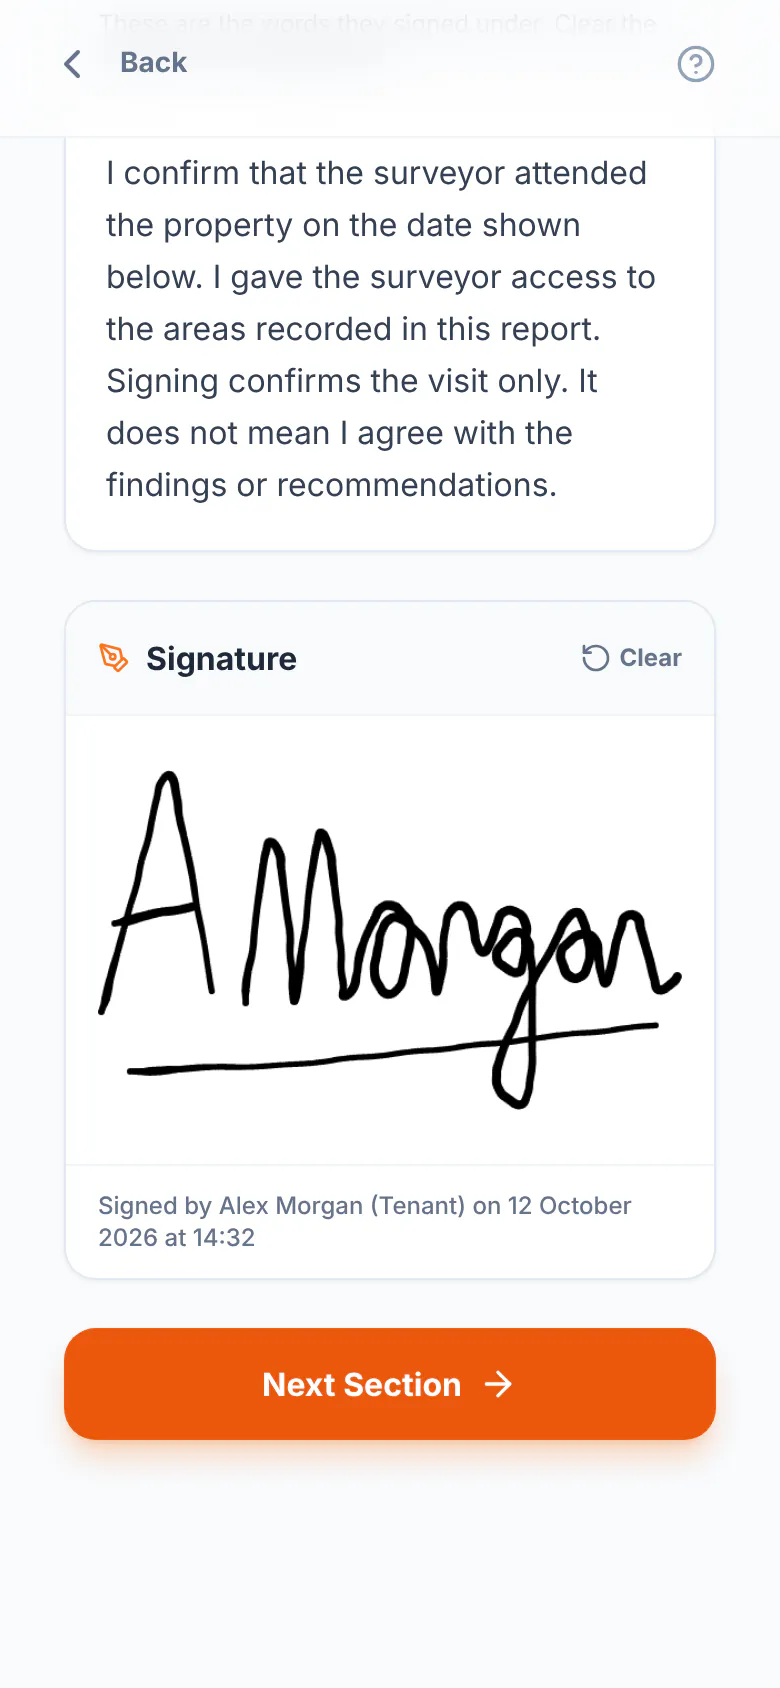
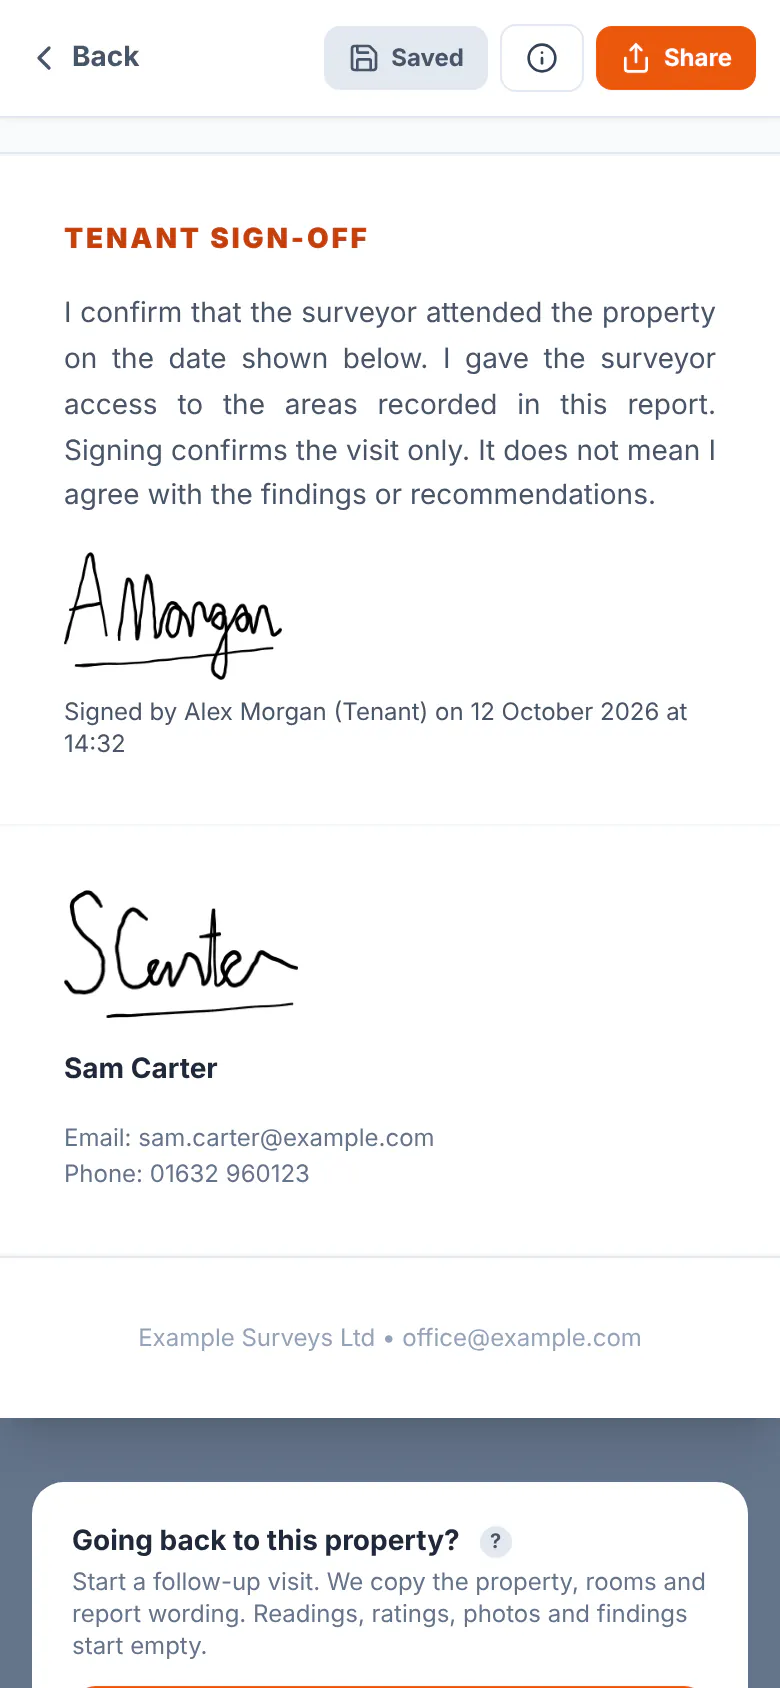
- In the report: the report screen and the PDF print the wording, their signature, their name and role, and when they signed, under a heading such as Tenant Sign-Off. When they did not sign, the report says why.
- The wording is kept: once they sign, the words they signed under stay with the survey. Clear the signature to change them.
- Required sections: add Client Sign-Off to Sections every report must have to stop a report being shared until it is signed or marked as not signed.
- Follow-up visits start with a fresh sign-off, as they do with your own signature.
- Turned off later, sign-offs already recorded are kept but no longer print.
A record of the visit
The standard wording confirms the visit and access only, not agreement with your findings. If you change it, keep it to what the person can confirm on the day.
Where to find it:SettingsReportsAbout UsCompany History / About Us
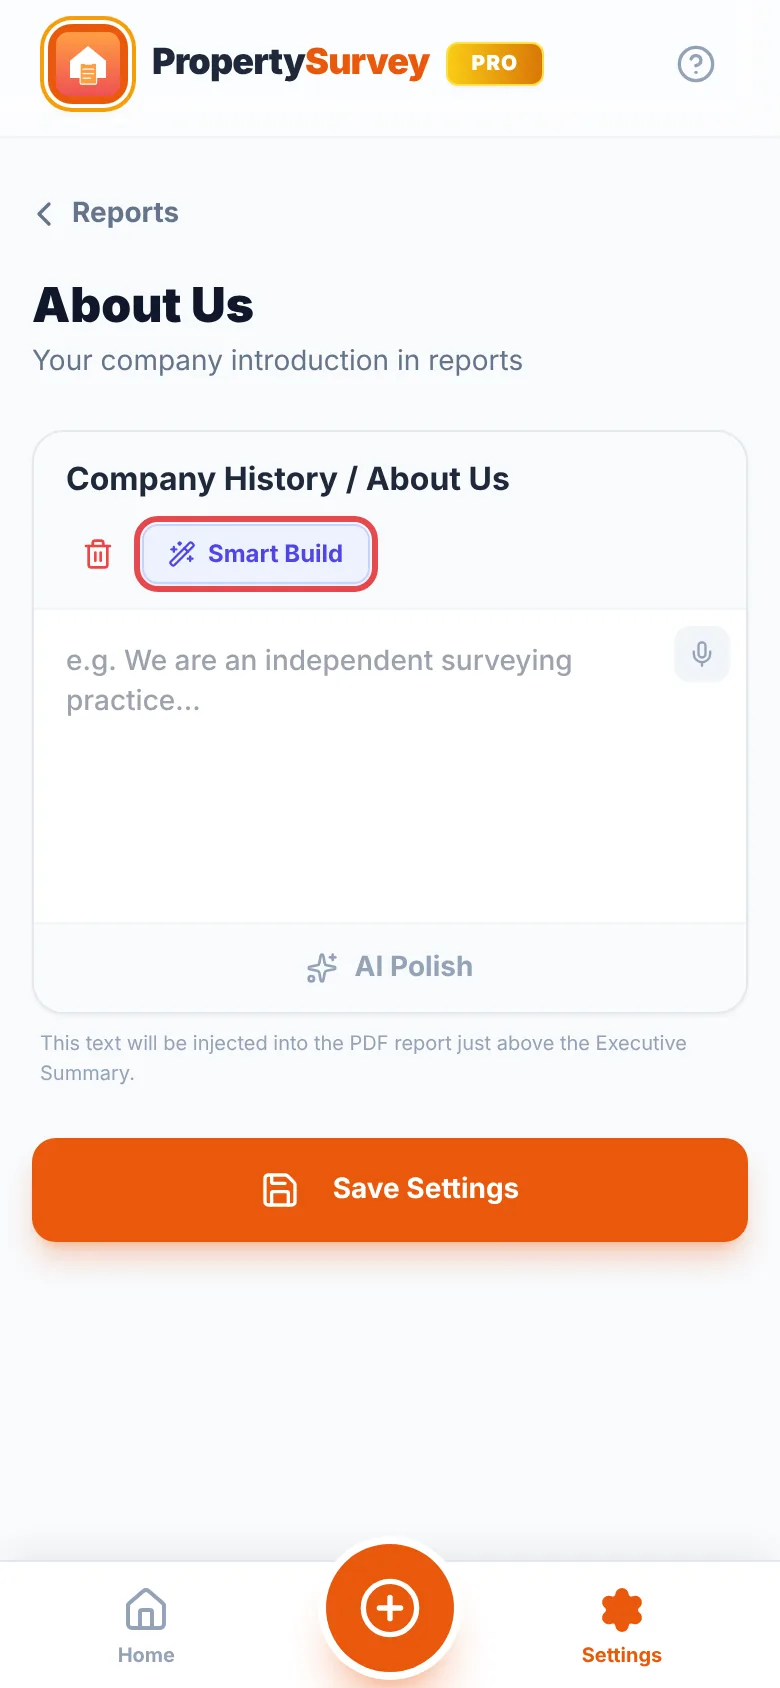
Write a short introduction to your business once, and it is used in every report. Smart Build can draft it for you, free, and AI Polish can tidy it.
Under “Settings” → “Reports” → “Independent surveyor disclosure”, add your standard independence statement. It prints with “Essential Costs” near the end of the report, and its Smart Build includes the usual caveats on estimated costs.
Each box has a switch to keep it in or out of your reports. One left empty never prints, even with its switch on. On a survey's “Essential Costs” screen you can switch the disclosure off or reword it for that survey only.
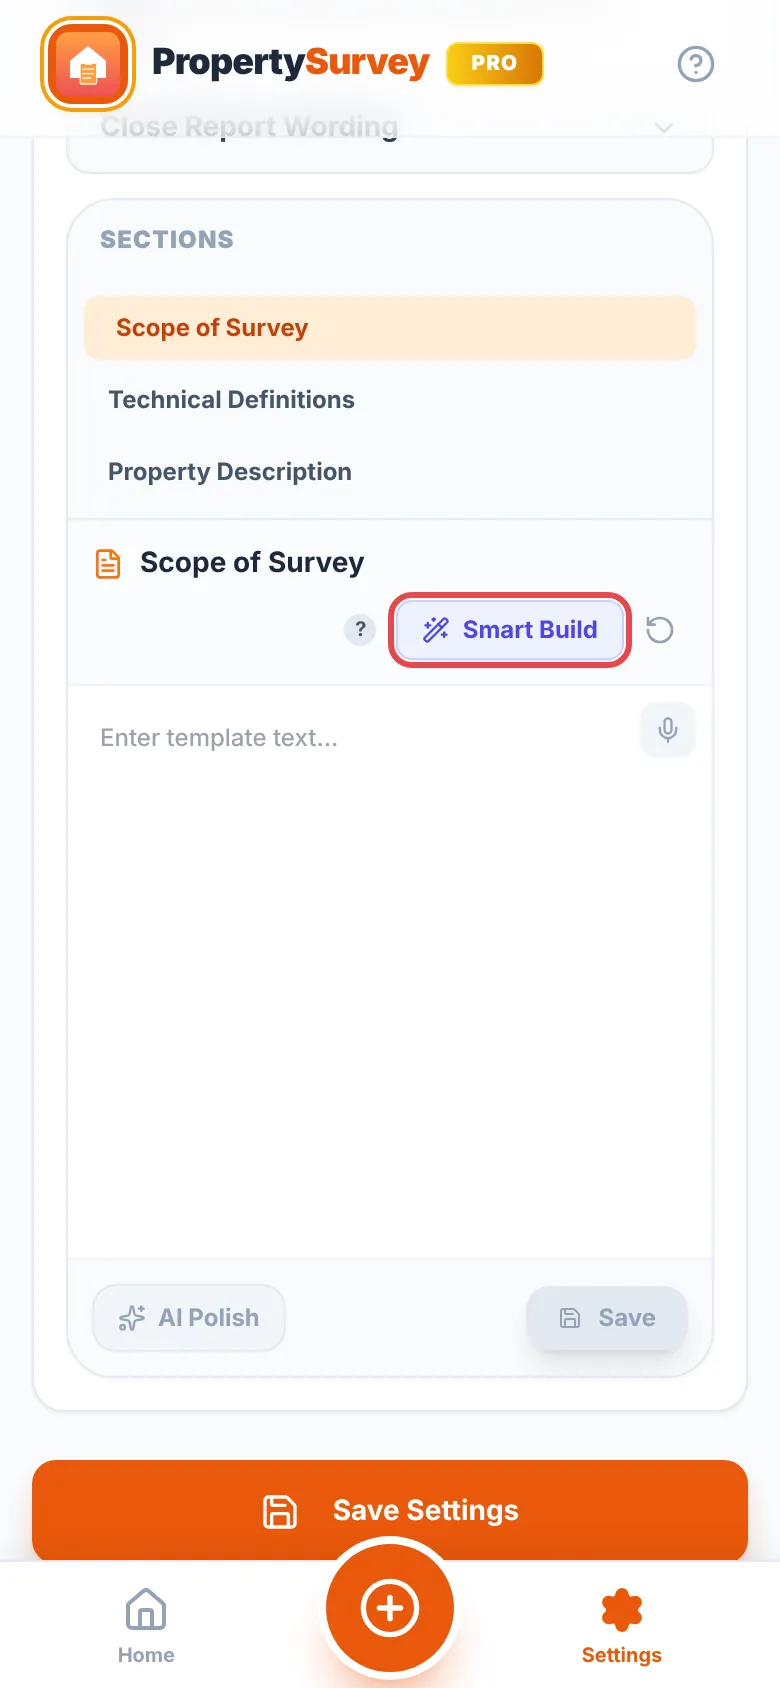
Default report wording PRO: in “Settings” → “Reports” → “Default report wording”, tap “Edit Report Wording” to set the text every new General Inspection starts with, such as “Scope of Survey”, “Technical Definitions” and “Methodology”.
- Pick a section.
- Type your own wording, or tap “Smart Build”, choose the options that fit your usual jobs and tap “Insert into field”.
- To tidy wording you typed, tap “AI Polish” under the text.
- Read it through and tap “Save”.
Surveys you have already started keep their own wording. From app version 1.7.0, default report wording is part of Pro. If you saved some on the free plan before then, your new surveys still start with it.
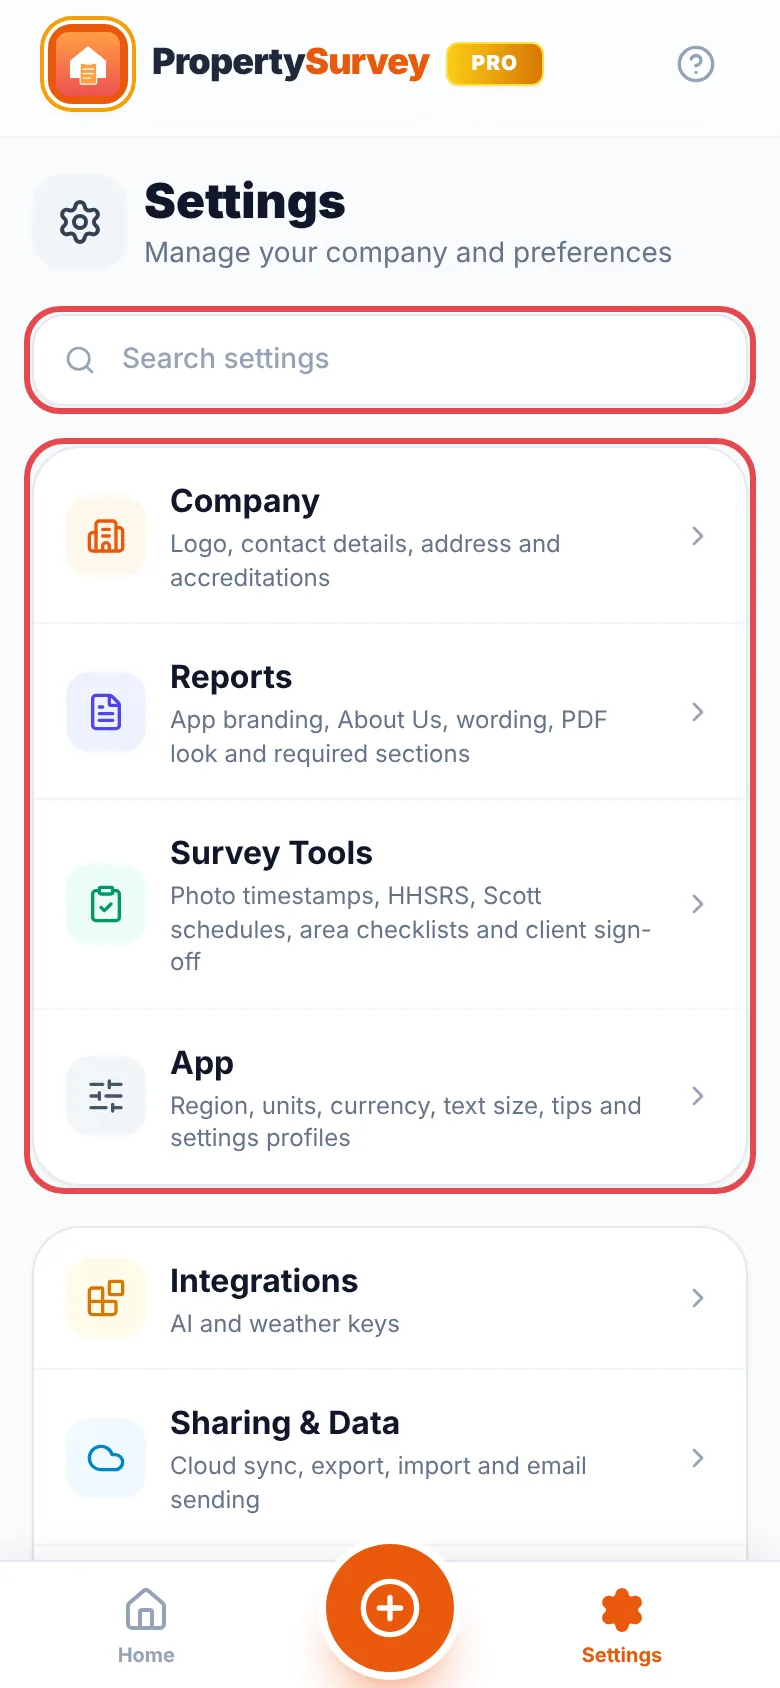
Tap the gear at the bottom right. Settings opens on a short list of groups. Tap one to open it, and tap a part of a group to open that part. Type in “Search settings” at the top to go straight to a setting.
- Language & Region: at the top. Your region sets the spelling, currency and temperature, and lists the standards and regulations that apply there PRO.
- Account: sign-in and cloud sync, your subscription, signing out and deleting your account.
- Lock Settings PRO: lock your settings with a PIN, straight from the Settings home page.
- Company: your logo PRO, company details and address, and accreditations and numbers.
- Reports: app branding, About Us, default report wording PRO, the PDF look PRO, visible narrative sections PRO and required sections.
- Survey Tools: photo timestamps, HHSRS scoring, Scott schedules, area checklists and client sign-off.
- App: units and currency, text size and feature tips.
- Integrations: your own AI and weather keys PRO (guide), and email sending.
- Backup & Transfer: JSON export and import, and settings profiles.
- Help & Legal: help and support, privacy choices, terms and notices, and the app version.
On a tablet held sideways, the groups stay on the left and the one you open shows on the right.
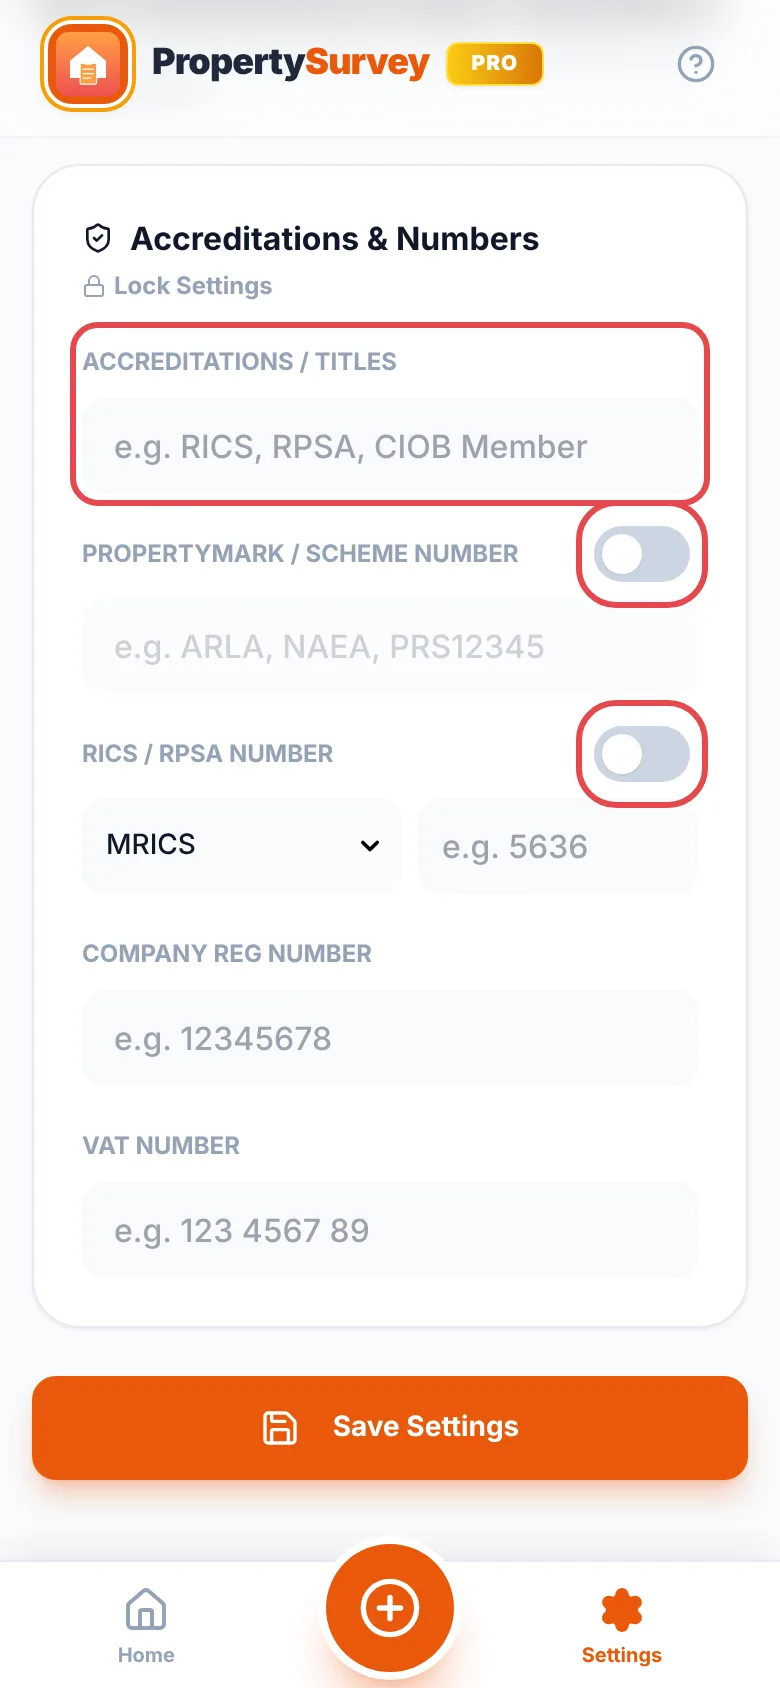
Accreditations: in Company → Accreditations and numbers, fill in “Accreditations / Titles”, and switch on “Propertymark / Scheme Number” or “RICS / RPSA Number” to add your number. They print as text on the report; logos of professional bodies are not added.
Where to find it:SettingsLock Settings
Stops anyone changing your company details or branding by accident. Useful when several people share a device.
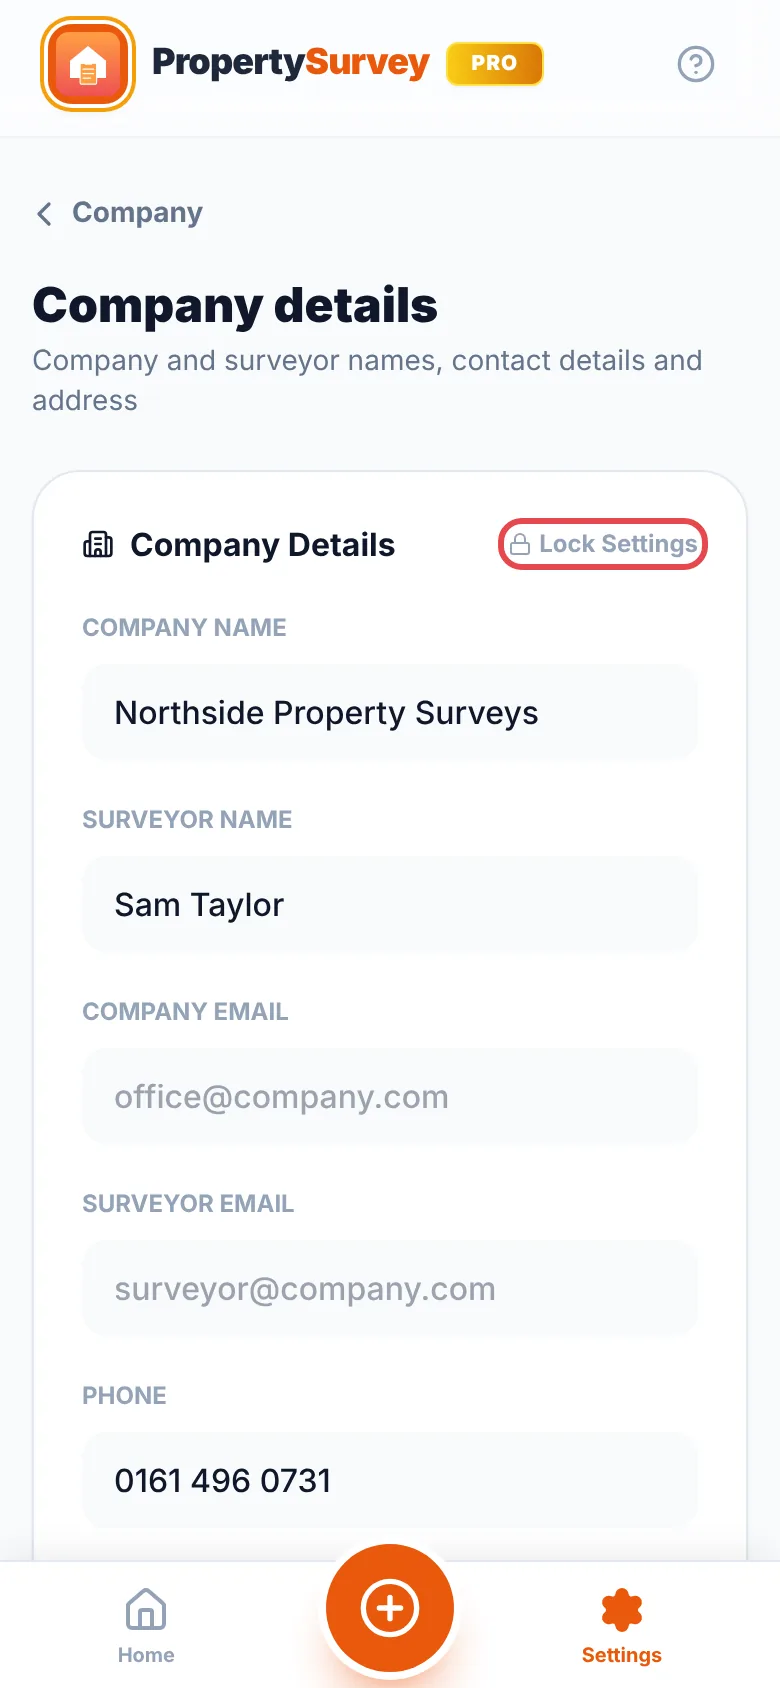
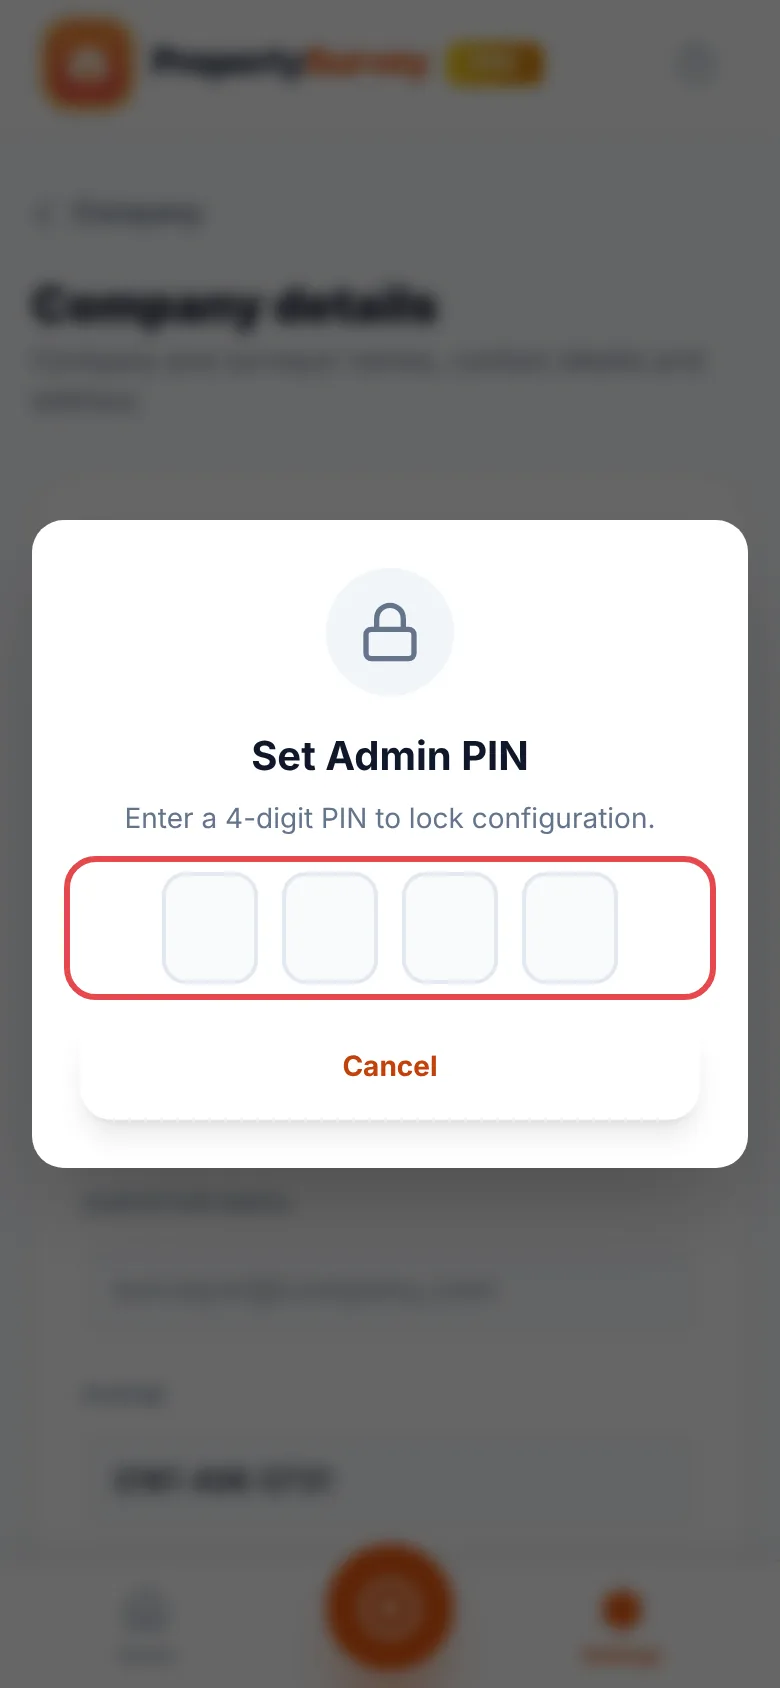
- On the Settings home page, tap “Lock Settings” under your account, then choose 4 digits for the admin PIN.
- The row now shows “Settings are locked”, and each page it covers says so at the top. To make changes, tap “Unlock” on that bar, or the row, and enter the PIN.
While Settings are locked, the required sections list can't be changed and a settings profile can't be imported. In a B2B organisation, your admin can also lock Settings from the B2B portal or your device management.
Write the PIN down
There is no reset in the app. If you forget it, contact support.
Where to find it:SettingsReportsRequired Sections
Choose the sections every report must have filled in before it goes out. This is free.
- Open “Required Sections” and tick the sections every report needs, such as the Executive Summary or the sign-off.
- On each survey, those sections carry a “Required” tag: amber until they are filled in, then green.
- In the report, Share, Email and Print stay blocked until every required section is filled in. The app lists any that are still empty.
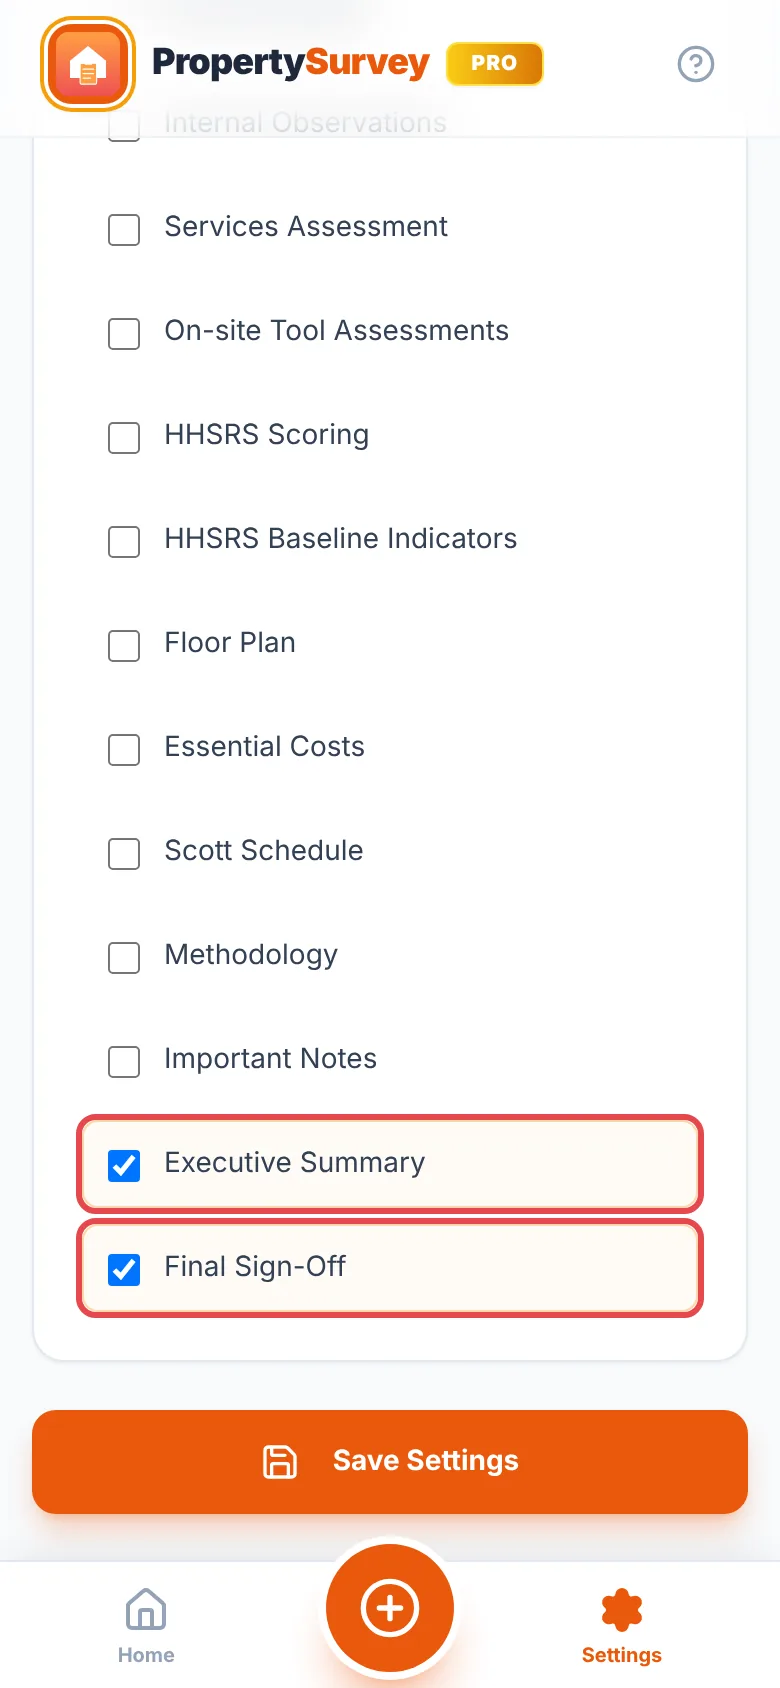
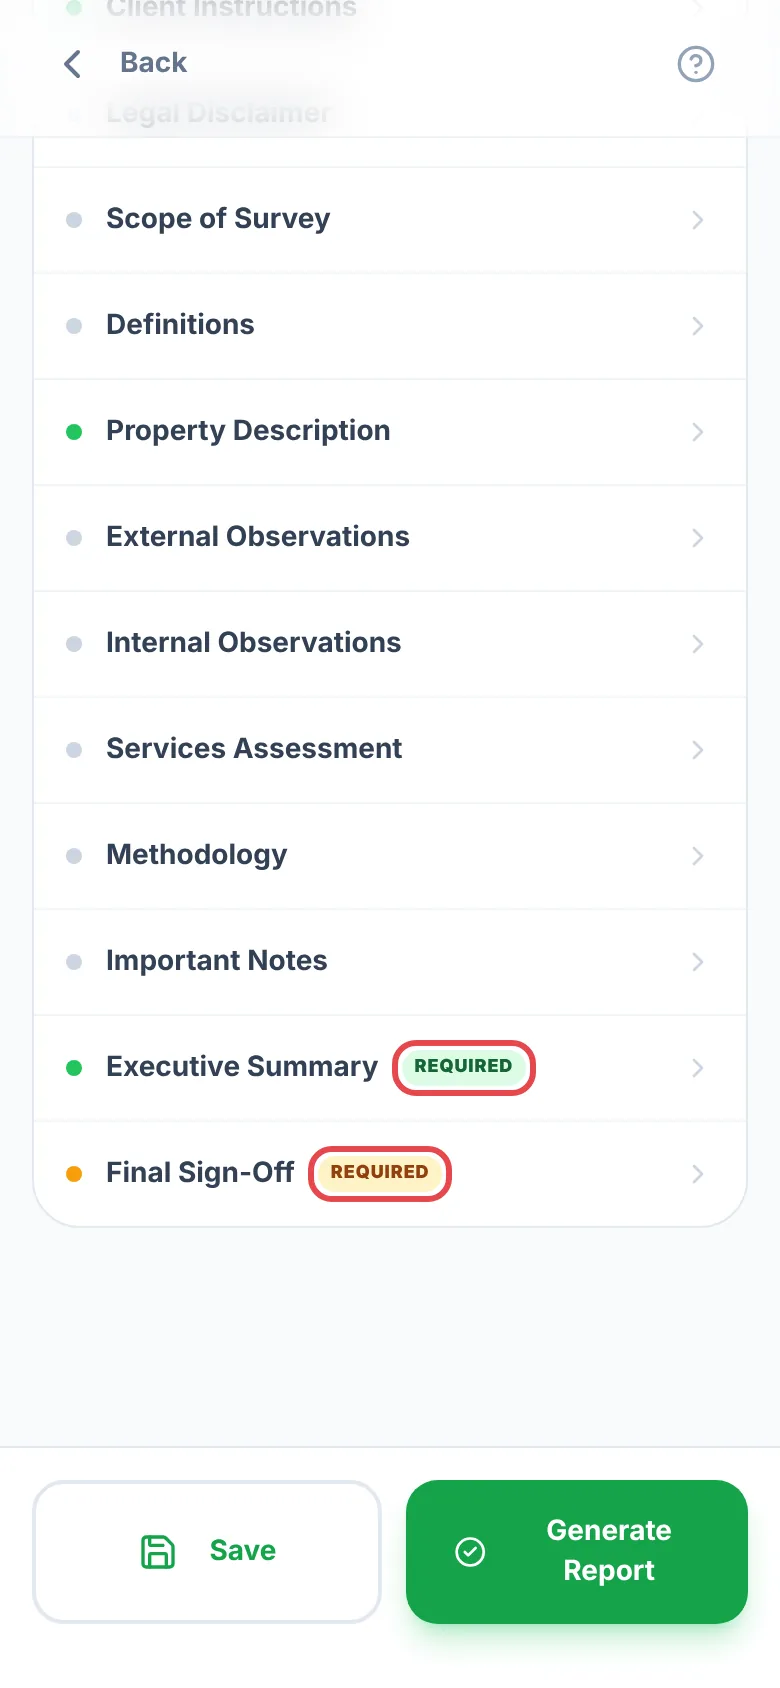
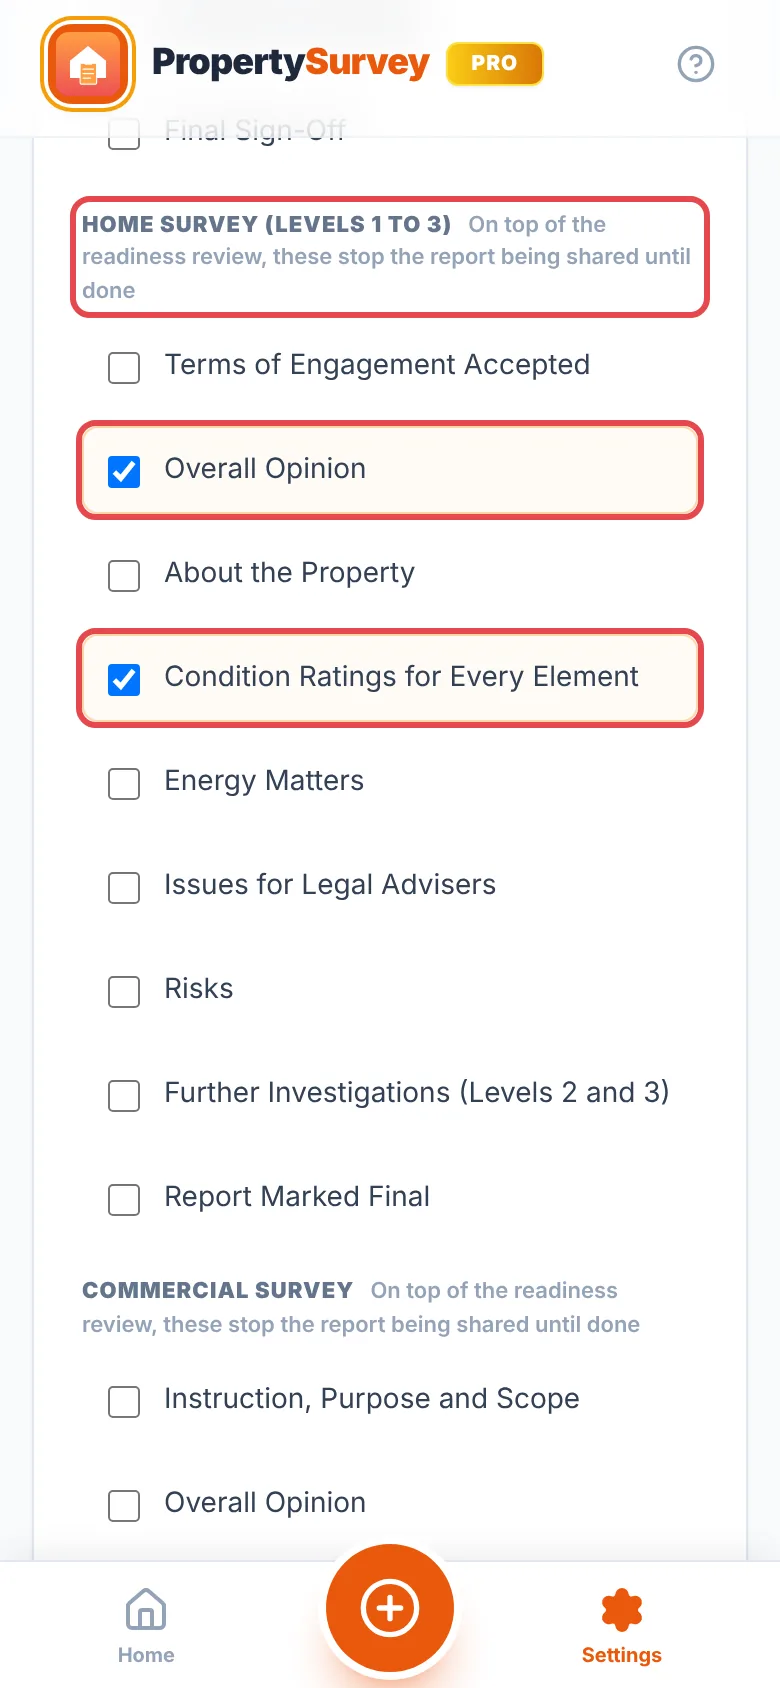
The list is grouped by survey type. Home Survey and Commercial surveys have their own required sections too, such as the overall opinion, a condition rating or priority for every element, legal matters, risks, and the report marked Final. Each report checks only the required sections it has, and in a Home Survey or Commercial survey the “Required” tag shows on the section in the survey's list.
Sections you have hidden can't be required. While Settings are locked, only someone with the admin PIN can change the list.
Where to find it:SettingsBackup & TransferSettings Profiles
Save your company details, logo and report settings as one file, then import it on another phone or tablet to set it up the same way. Your name, signature, email server and API keys are not included.
- On the device that is set up, tap “Export” and save or send the file.
- On the other device, tap “Import”, pick the file and confirm. Its settings replace that device's. Surveys stay as they are.
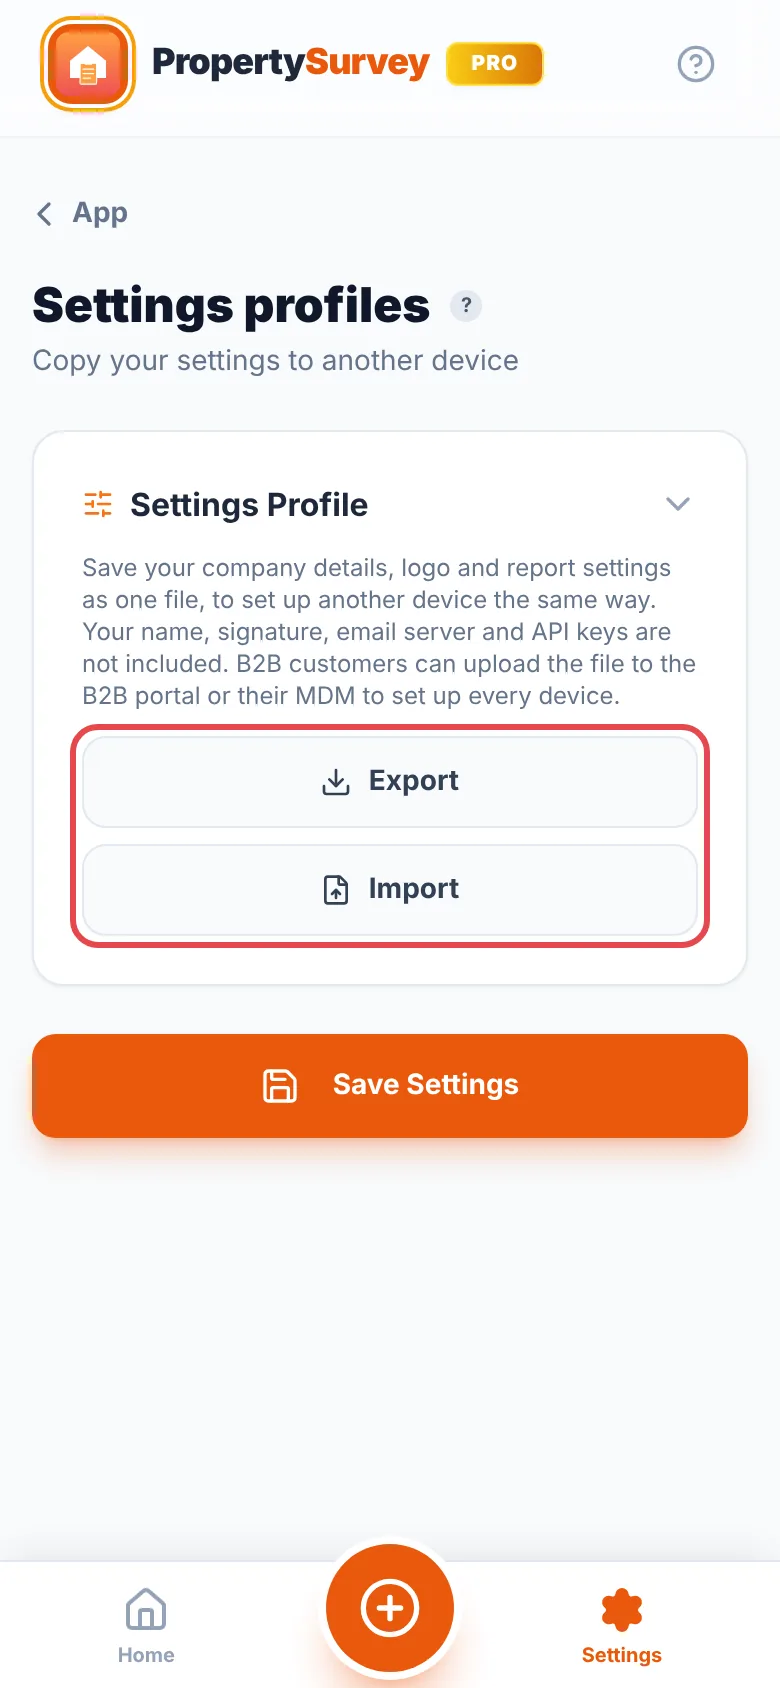
While Settings are locked, unlock them with the admin PIN before importing.
For B2B organisations
Your admin can upload the file to the B2B portal's App Settings, or add it to your device management, to set up every device or chosen ones, and lock Settings if they choose. Settings then shows that your organisation manages them. How admins set up App Settings.
Your own AI and weather keys
For Pro, and recommended. The app works without them, but only up to our daily limits; your own keys remove those limits.
We recommend adding your own key. The AI tools work without one, but only up to our daily limit. Your own key removes that limit, and you pay Google directly for what you use, usually a few pence a day.
Gemini now needs billing switched on
Google's free allowance is now too small for everyday survey work. Set up prepaid billing in Google AI Studio and add a monthly spend cap. The guide shows exactly how, with a cap so you are never surprised by a bill.
Open the step-by-step Gemini guide →
In short: create a key at Google AI Studio (opens in a new tab), set up billing with a spend cap, then in the app go to SettingsIntegrationsAI and Weather KeysGoogle Gemini, paste it into “Google Gemini API Key” and tap “Save & Sync Settings”.
Not sure whether to use Gemini or OpenAI? Compare them here.
ChatGPT Plus does not include this
The OpenAI key is billed separately from any ChatGPT subscription. You buy prepaid credit (from US$5) on OpenAI's developer site. With no credit, the key does not work.
Open the step-by-step OpenAI guide →
In short: at platform.openai.com (opens in a new tab) buy credit, switch off auto recharge, set a monthly limit, then create a key. In the app go to SettingsIntegrationsAI and Weather KeysOpenAI, paste it into “OpenAI API Key”, leave “OpenAI Model” on “Automatic (newest GPT mini)” and tap “Save & Sync Settings”.
Recommended. Pro fetches weather without a key, but only up to a daily limit. Your own OpenWeatherMap key removes that limit, and their starter plan normally covers survey use at no cost.
Open the step-by-step weather key guide →
Ignore the paid subscriptions
Older instructions, including ours, said to subscribe to OpenWeatherMap's “One Call 3.0” with a card. You do not need it: the key from sign-up is enough for live weather. Leave the second box, “OWM Maps 2.0 API Key (Overlays)”, empty unless you already pay for Weather Maps 2.0.
Fix a problem & get support
Common messages, what they mean, and how to reach us.
| What you see | What to do |
|---|---|
| “AI Limit Reached” | You have used this month's free uses of that tool. They reset on the 1st, or upgrade to Pro. |
| “Daily AI Limit Reached” | You have used today's AI allowance on our built-in service. Try again tomorrow, or with Pro add your own AI key. (The message mentions a free key; Gemini now needs billing, as the guide explains.) |
| “API Rate Limit Exceeded” | Your own key hit its provider's limit or ran out of credit. Wait a minute and try again, then check your credit and spend cap: Gemini · OpenAI. |
| “API Key required. Check Settings.” | Your key was not accepted. Copy it again from the provider, paste it with no space at the end, and tap Save & Sync Settings. |
| “Our free AI service is temporarily at capacity” | Our service is busy. Nothing was used up. Try again in a few minutes. |
| “Daily weather limit reached” | Today's weather allowance is used. Add your own weather key, or type the readings. |
| No rain on the radar | It has not rained there in the last two hours. That is correct. |
| Soil data takes a long time | The soil database can be slow. Give it a minute, or try again later. |
| Surveys not syncing | Check your signal, that Pro is active and that you are signed in. Update the app, then sign out and back in. |
| Photos missing after importing a JSON file | Free exports do not include photos (why). |
| Pro not showing on a new phone | Restore your purchase. |
| Share button missing | Tap Save in the report first. Share appears once changes are saved. |
Still stuck? See Contact support.
Where to find it:SettingsHelp & LegalHelp and SupportSubmit Feedback / Bug Report
- Say what you were trying to do and what you see on screen.
- Tap “Attach Screenshot or PDF” to add a screenshot (images or PDF under 5 MB).
- Tap “Send Message”. Your phone model and app version are sent with it, so we do not need to ask.
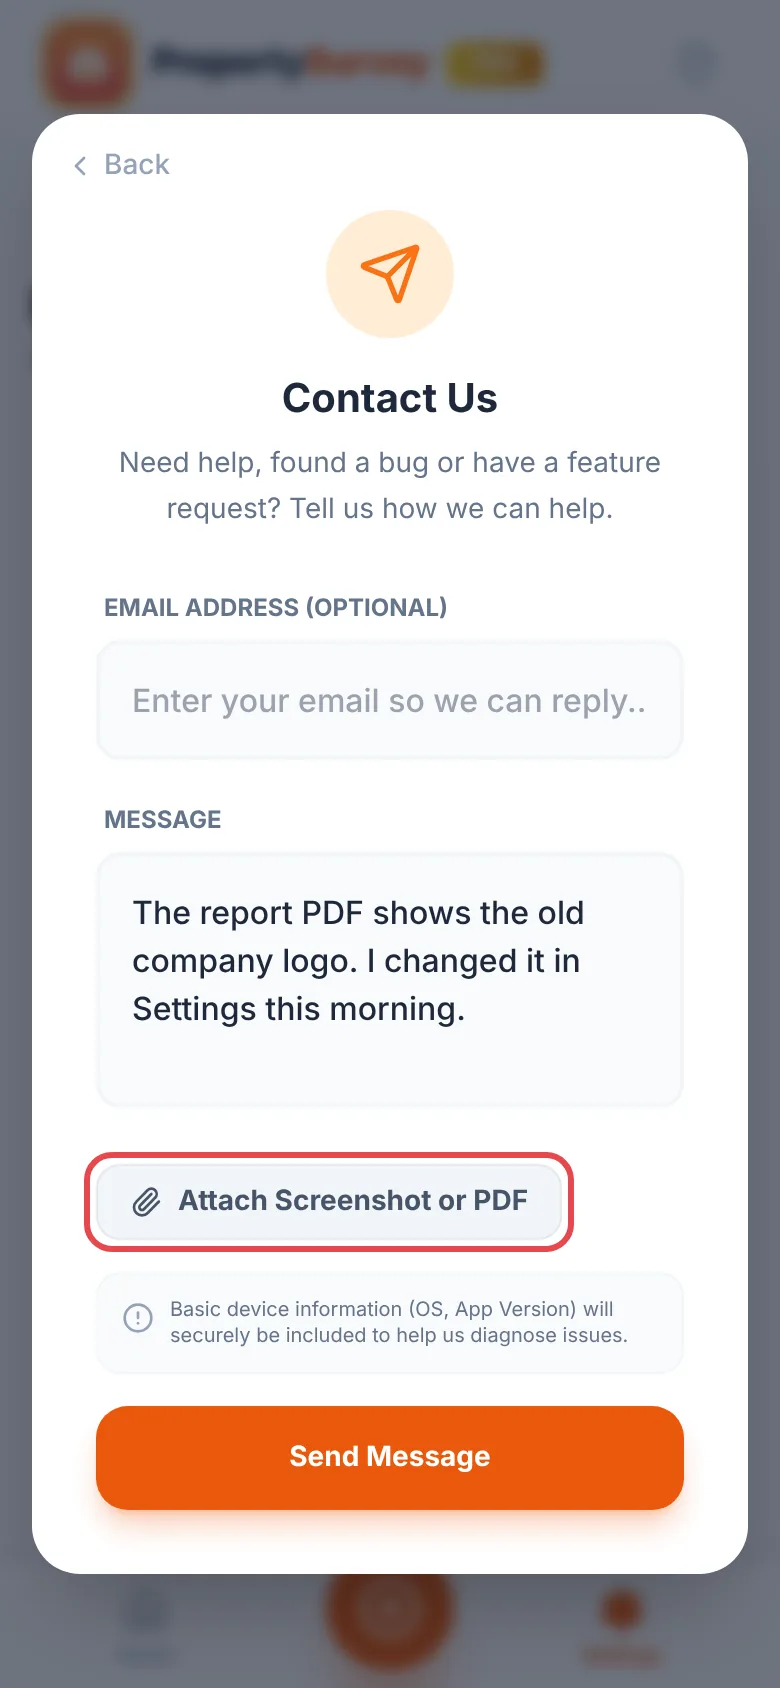
You can also tap the “?” at the top of the home screen, or use the support form on this website.
B2B teams
B2B admins can set company details, report wording, required sections and more for every device from the B2B Account, or send them through device management (MDM).
- Sign in to your B2B Account and open “App Settings”.
- Choose “New Profile”, give it a name and pick “All Devices” or “Chosen Devices”.
- Tick “Set by Your Organisation” beside each setting you want to control. Under About Us, the disclaimers and each Default Report Wording section, “Smart Build” and “AI Polish” help you write the text.
- To give every device your AI and weather keys, use “Organisation AI & Weather Keys” in App Settings. A profile's “AI & Weather Keys”, or “Device Keys” for one device, take priority over them. Devices use them without showing them, and surveyors can't change them unless you let surveyors use their own keys.
- Choose “Save Profile”. Devices pick it up the next time the app opens or checks in.
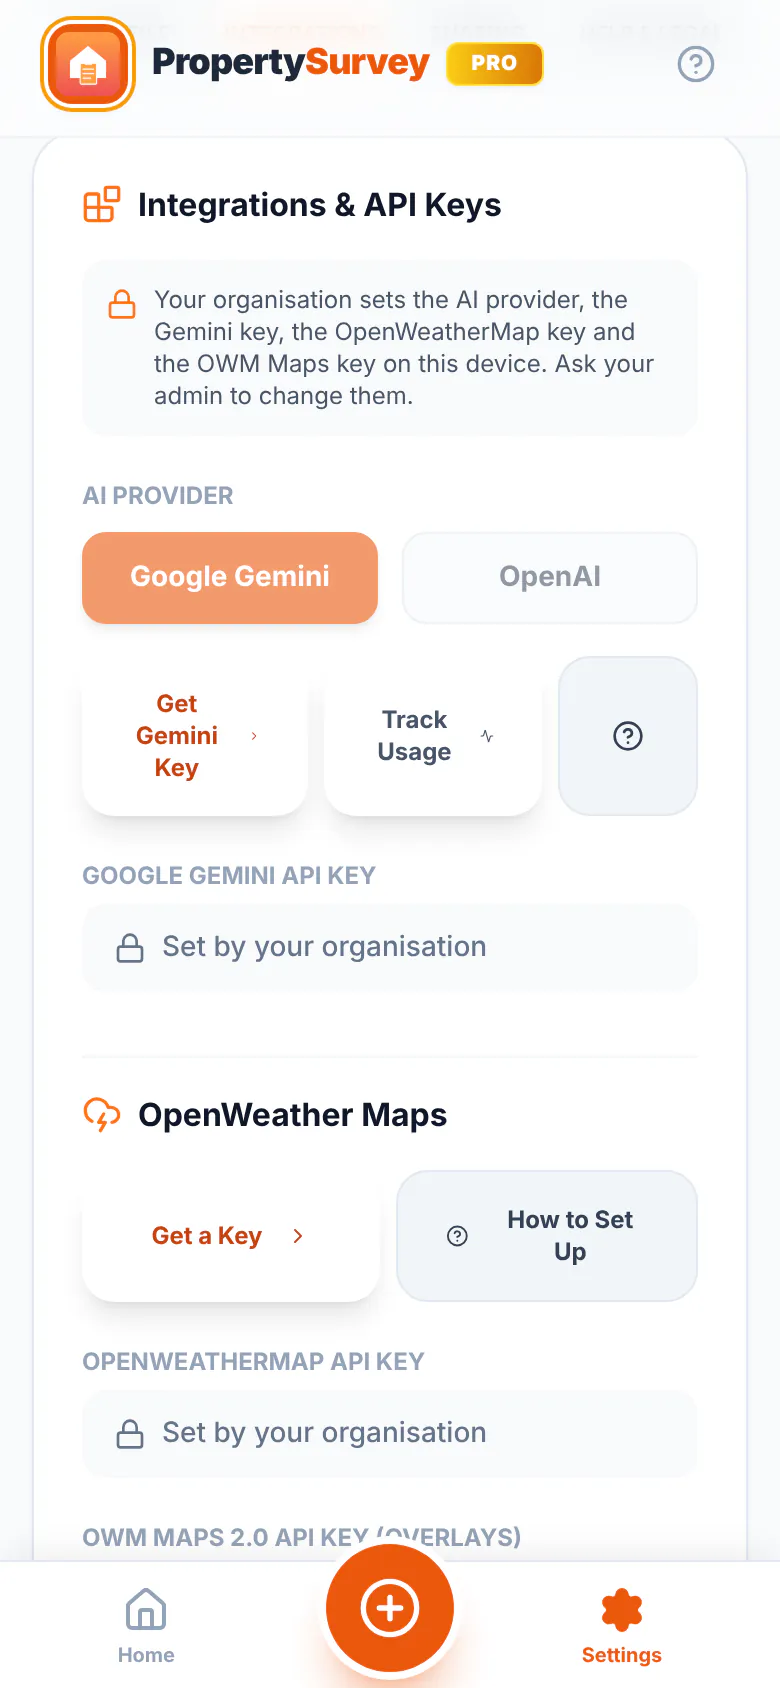
To fix a surveyor's name and accreditations on a device, choose “Assign Surveyor” for it in “Devices” or App Settings. Their email and signature always stay their own. Read the full guide, with locking and MDM examples →
The B2B edition is licensed to your organisation. Administrators manage licences and devices in the B2B Account; surveyors activate the app on their device without a portal login.
- Licence status shows at the top of Settings in B2B builds.
- The app checks its licence about every three days when online, and keeps working offline for up to fourteen days after a successful check.
- B2B surveys stay on the device. The consumer sign-in, sync and subscription articles in this Help Centre do not apply.
Team pricing: B2B team licensing. Rolling out to devices: deployment guide. Setting up devices together: App Settings guide. Admins: open your B2B Account.
Still need help?
Tell us what you were trying to do and what you can see on screen. A screenshot helps. The quickest route is Settings → Help & Legal → Submit Feedback / Bug Report in the app, which sends your app version with the message.
Contact Support